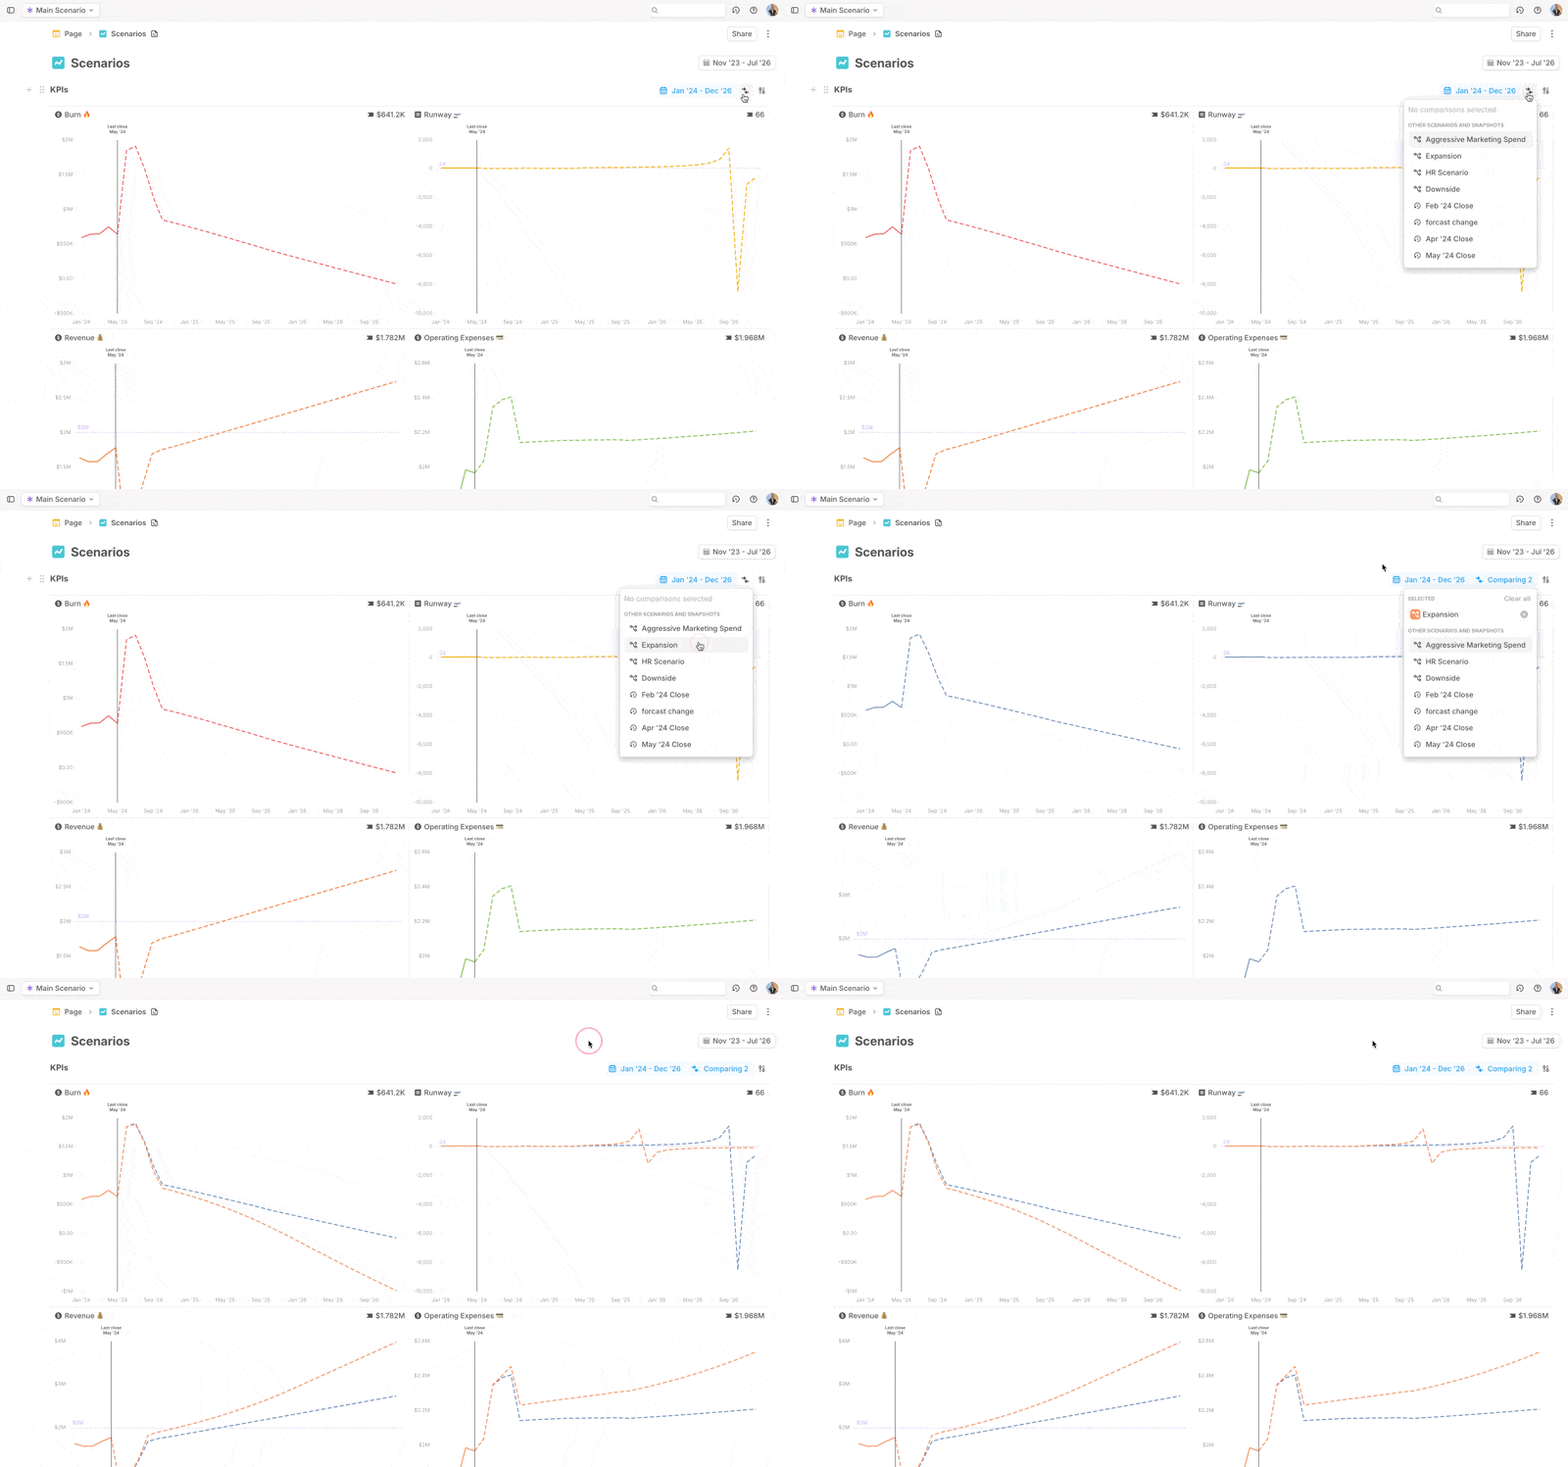
Step 1: Lock your budget
Your budget lives in a scenario. Lock it before running BvA so later Main updates and team edits do not change the comparison baseline.1
Disable updates from Main
In scenario settings, set Pull updates from Main to Disabled. This prevents Main changes and integration sync changes from updating the budget scenario.
2
Prevent edits when needed
If the budget should be read-only, disable editing in scenario settings.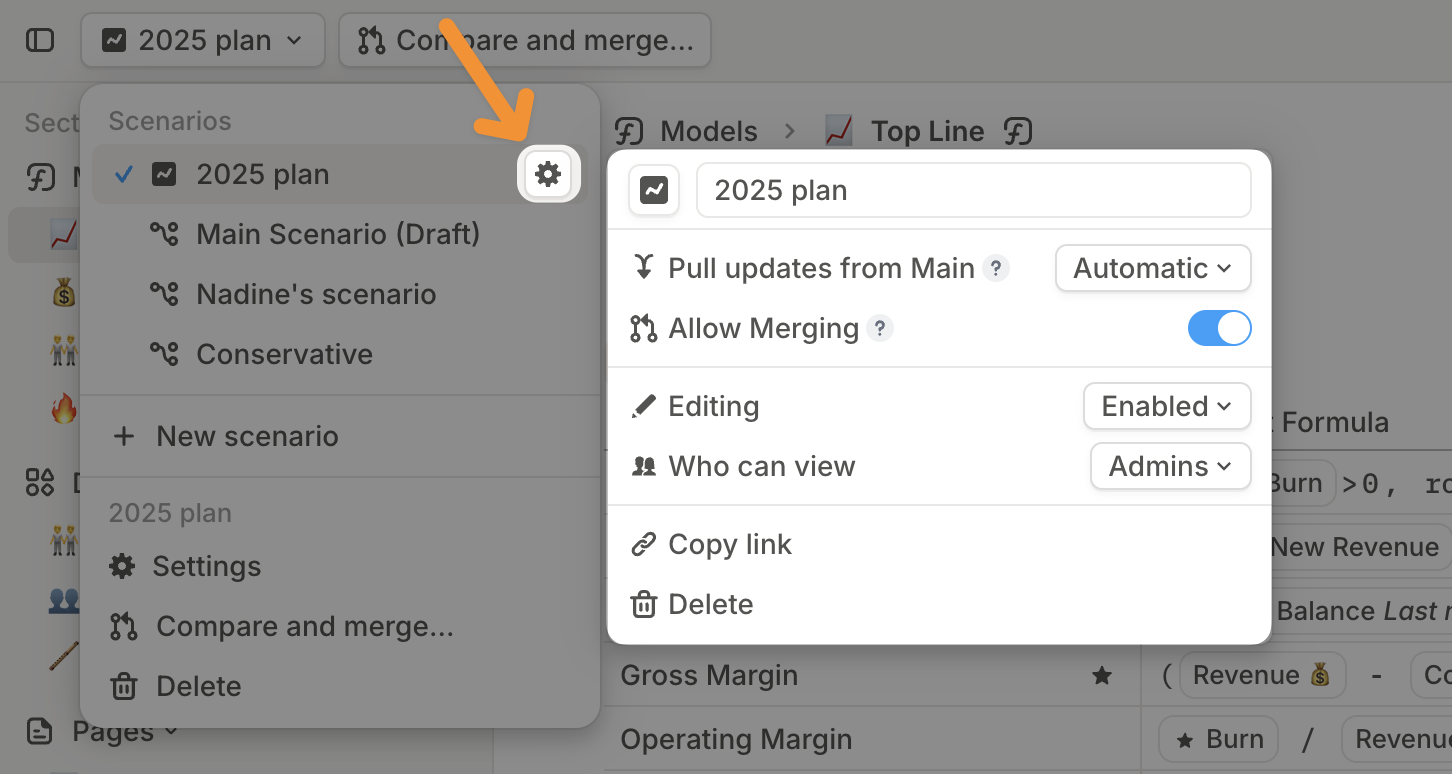
Step 2: Set up your actuals
Actuals come from Main and are governed by last close.1
Open Main
Switch to Main.
2
Set last close
Set last close to the end of the period you are analyzing. For example, to compare January through March, set last close to March.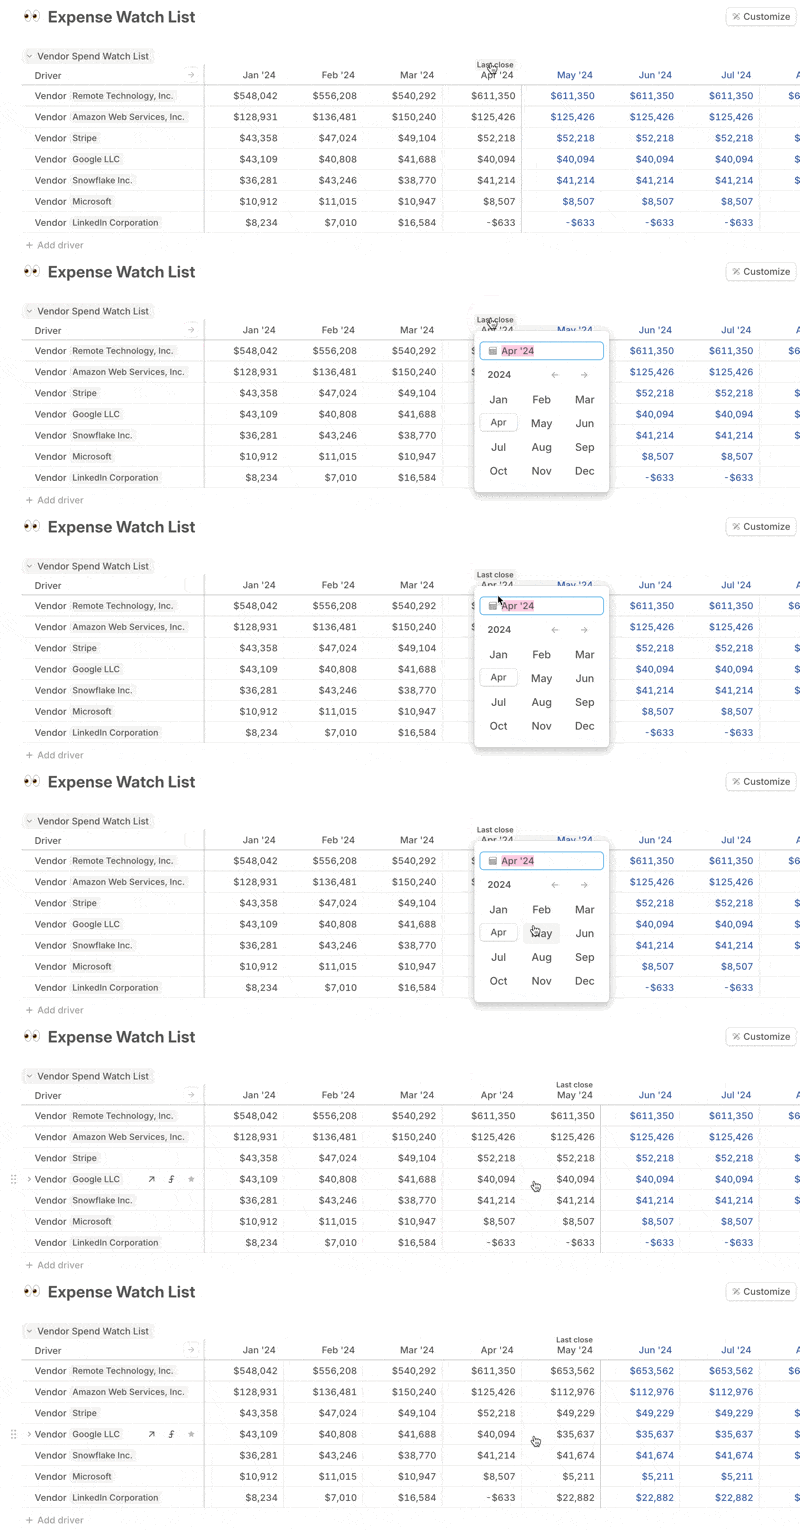
3
Review formulas
Confirm that actuals formulas are populating closed months and forecast formulas are taking over after last close.
Step 3: Compare budget vs. actuals
You can analyze variances in tables or charts.Create a BvA table
1
Open a model or page table
Open a model or create a Driver table block on a page.
2
Add drivers
Add the drivers you want to include in the BvA.
3
Choose comparison scenarios
Click Customize, select Compare, and choose the budget scenario.
4
Review variance
In comparison view, Variance and Variance % are on by default. You can toggle comparison metrics from the same menu.
5
Choose layout
Show scenarios as rows or columns.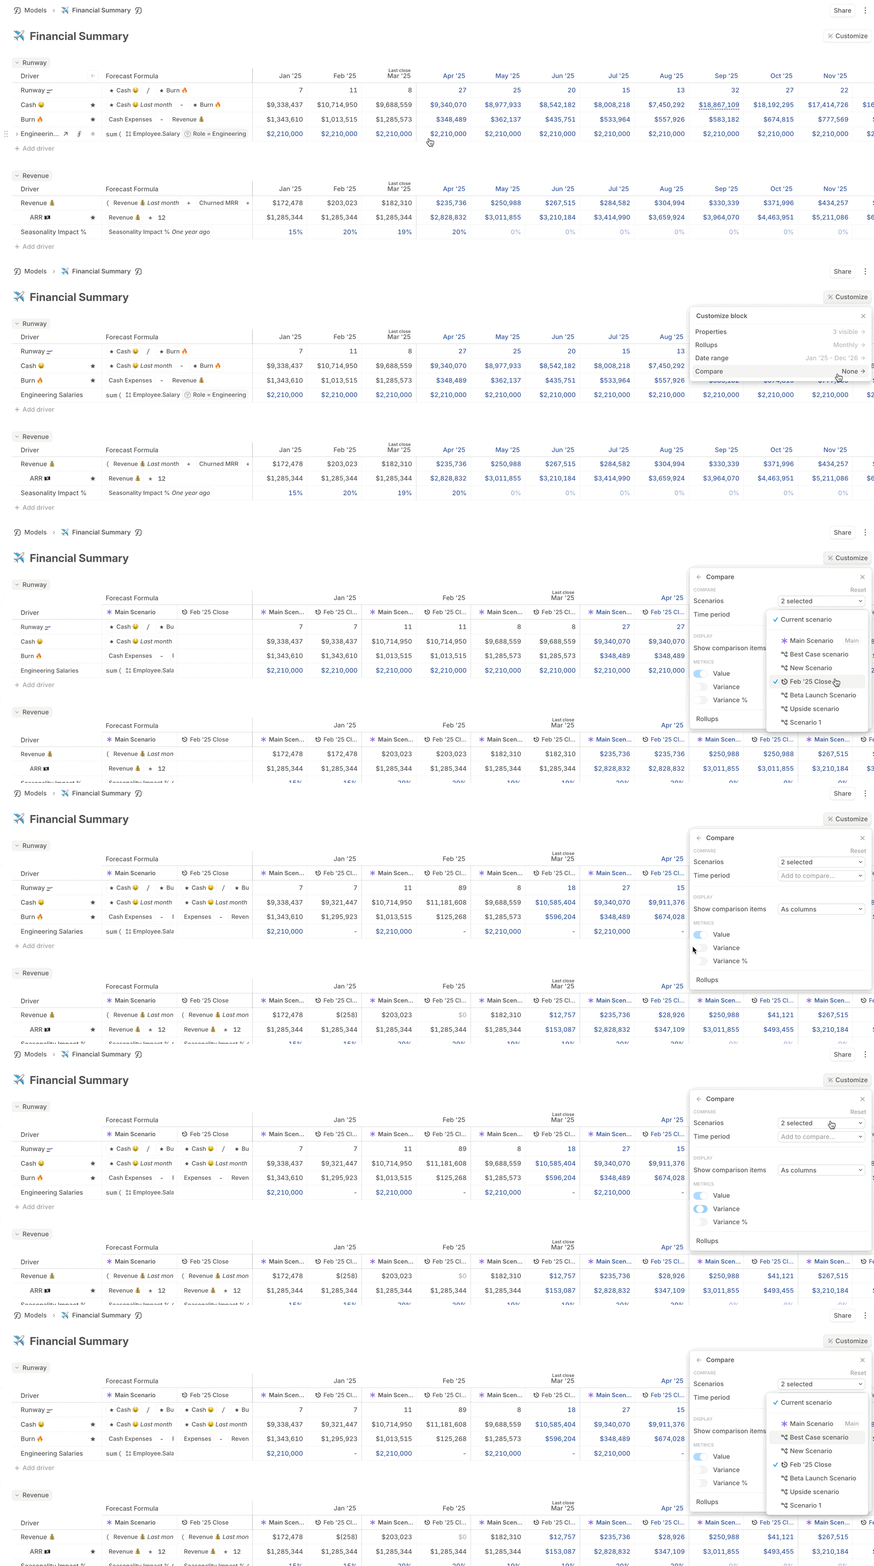
Customize variance display
Variance colors follow the driver’s comparison-color setting. For example, expenses usually use a setting where lower values are better, while income usually uses a setting where higher values are better. Variance respects the driver’s abbreviation setting, so thousands and millions display consistently with the rest of the driver table.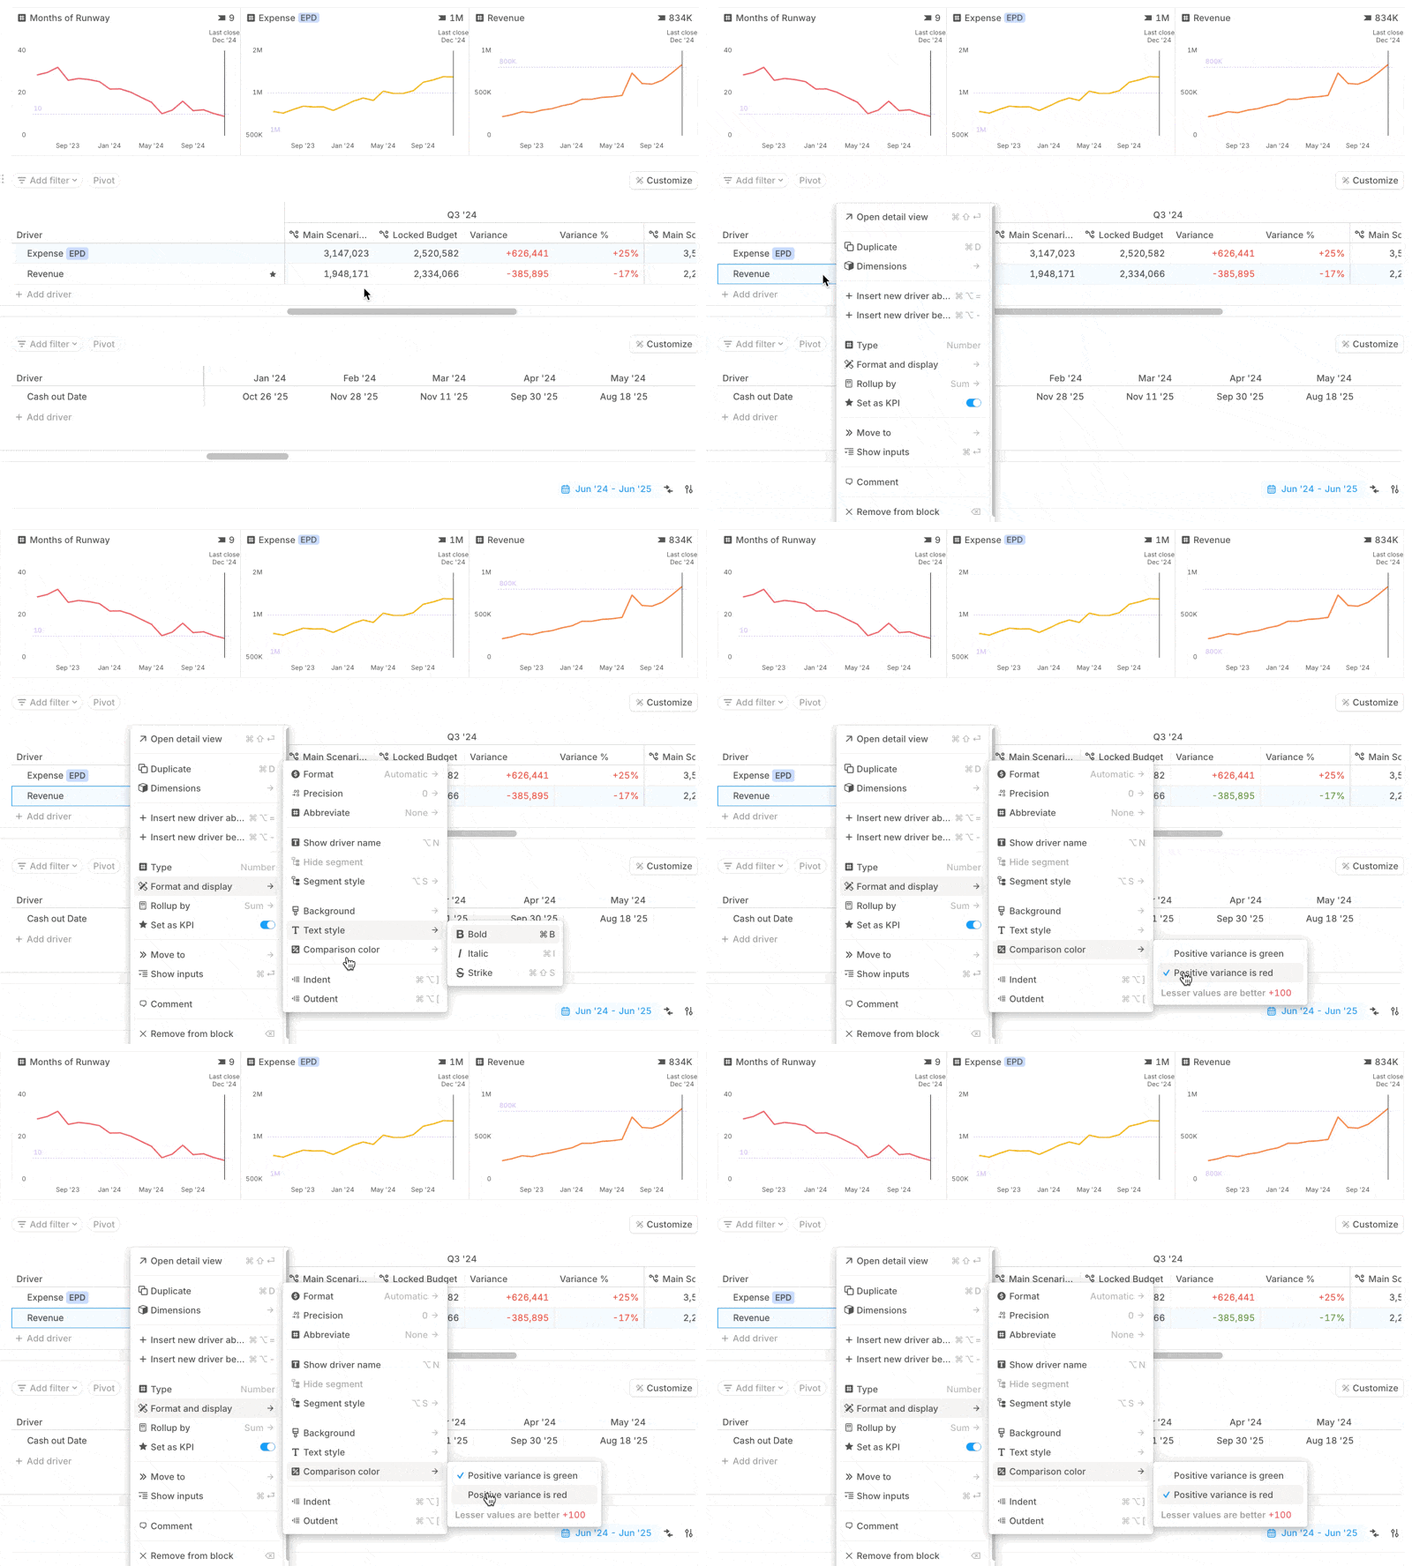
Create a BvA chart
1
Create a chart
Create a Driver charts block on a page.
2
Add drivers
Add the drivers you want to compare.
3
Compare scenarios
Click Compare and select the budget scenario.
4
Choose chart type
Use a line or column chart to show trends.