

Creating a driver table block
1
Open block options
On a page, type / to access block options.
2
Choose Driver table
Select Driver table.
3
Choose drivers
Choose the drivers you want to include. You can add or remove drivers later.
Customizing table columns
When you first add a driver table block, it displays the driver name and data by default. You can choose which columns appear.1
Open Customize
Click Customize in the top-right corner of the block.
2
Open Properties
Select Properties.
3
Choose columns
Show or hide columns such as Data, Actuals Formula, Forecast Formula, Used By, Graph, and Rollup.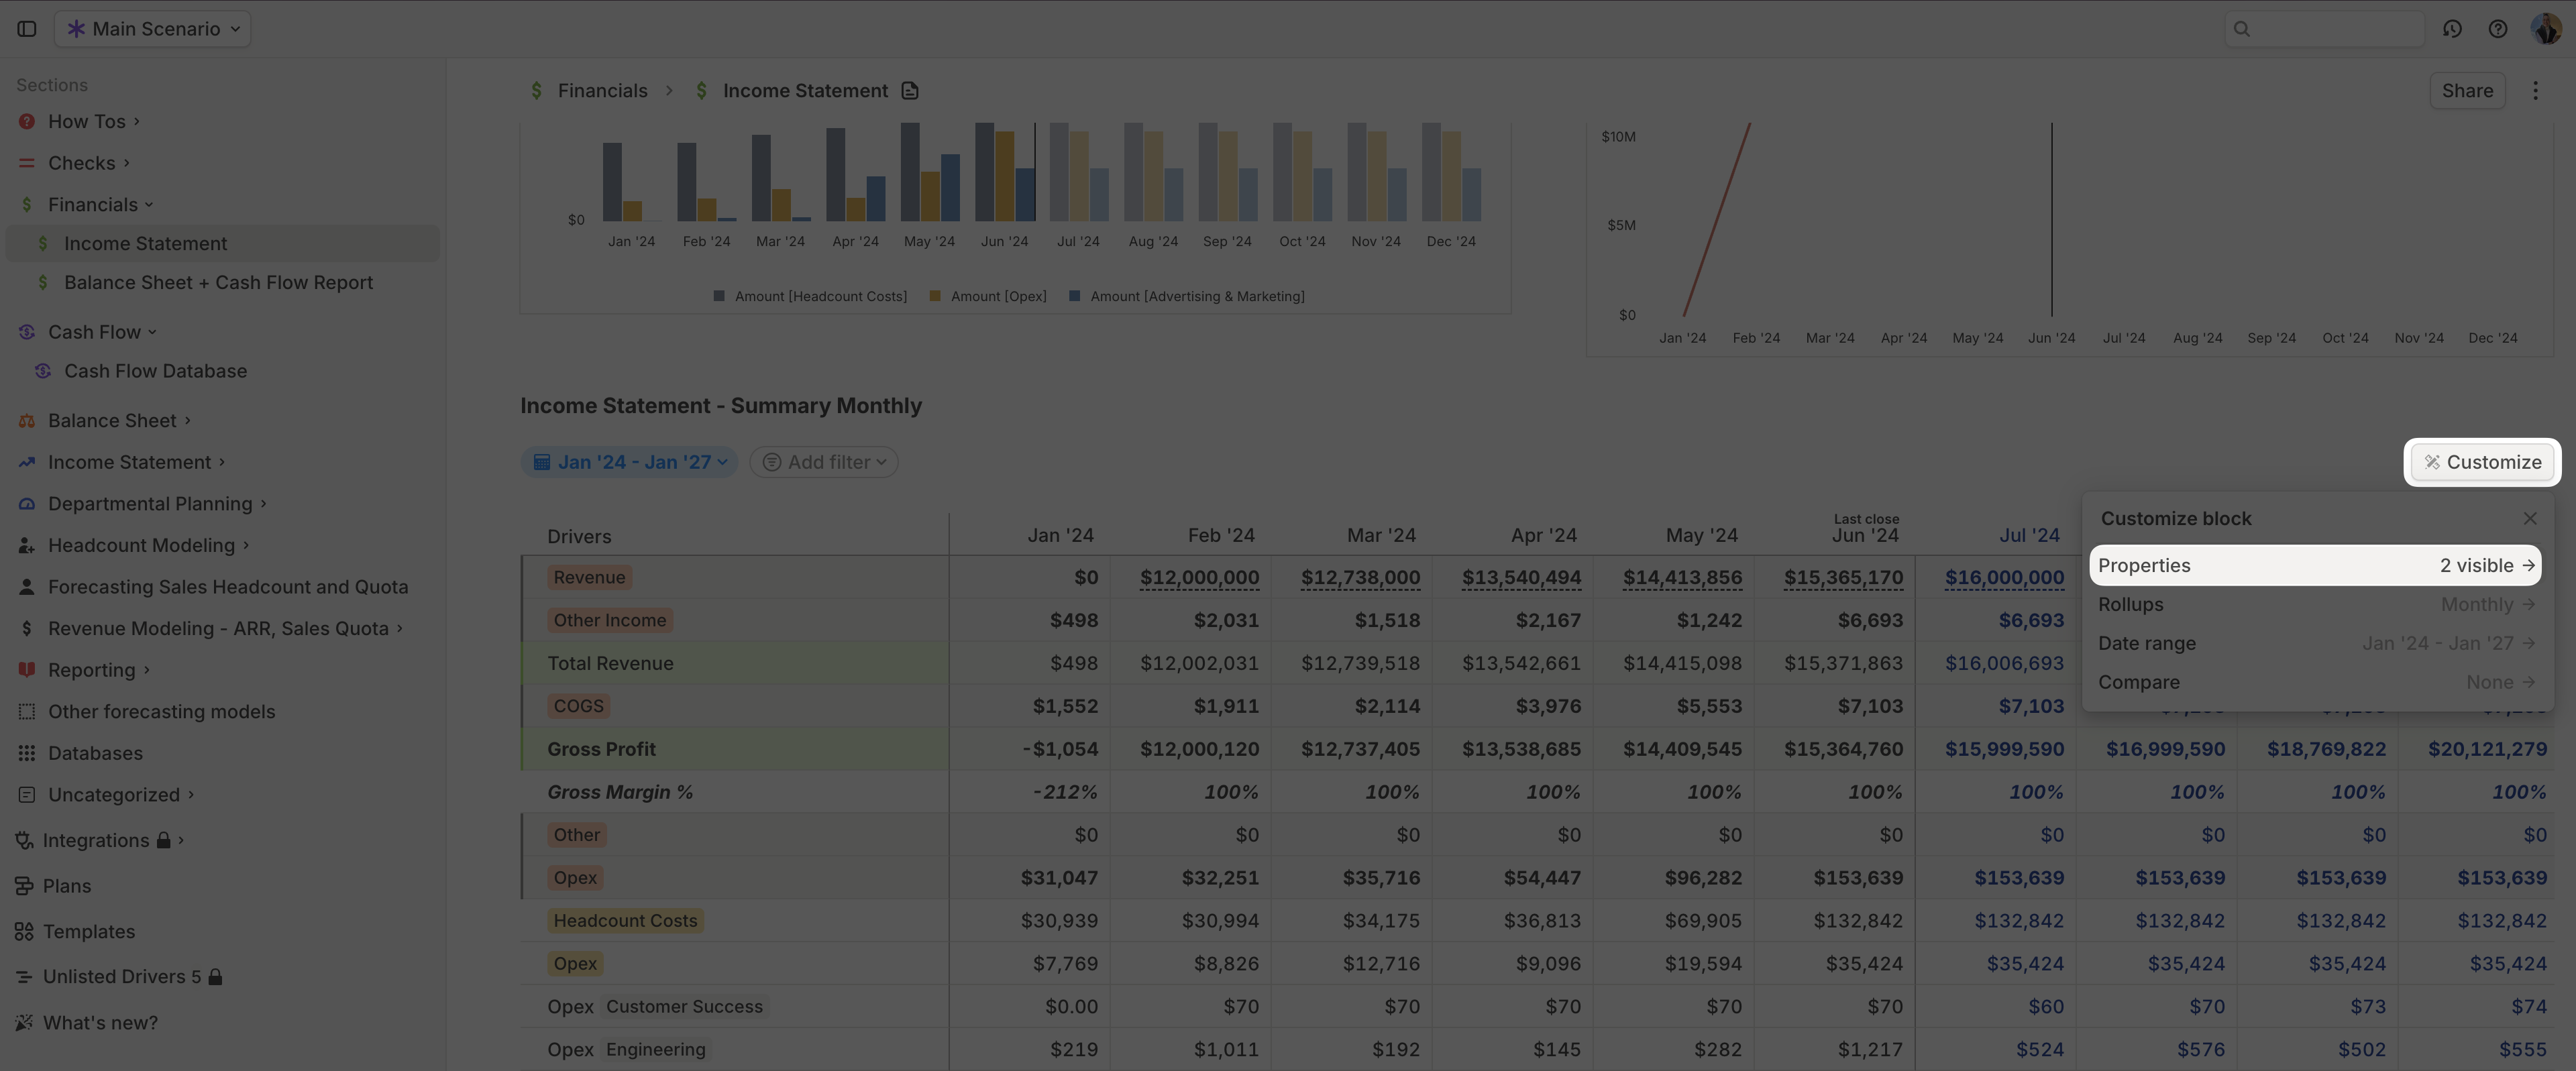
Viewing formulas in the table
Driver table blocks can show formula columns alongside values.1
Open Customize
Click Customize in the top-right corner of the block.
2
Open Properties
Select Properties.
3
Show formula columns
Enable Actuals Formula or Forecast Formula.
⌥⇧A on Mac or Alt+Shift+A on Windows, toggle Forecast Formula with ⌥⇧F on Mac or Alt+Shift+F on Windows, and toggle pinned formula columns with ⌘⌥P on Mac or Ctrl+Alt+P on Windows.
Managing drivers in the table
Use + Add driver to add existing drivers or create a new driver directly in the block. To insert a driver near another driver, right-click a driver name or open its left-side menu, then select + Insert new driver above or + Insert new driver below. The shortcuts reference lists the keyboard shortcuts for inserting rows.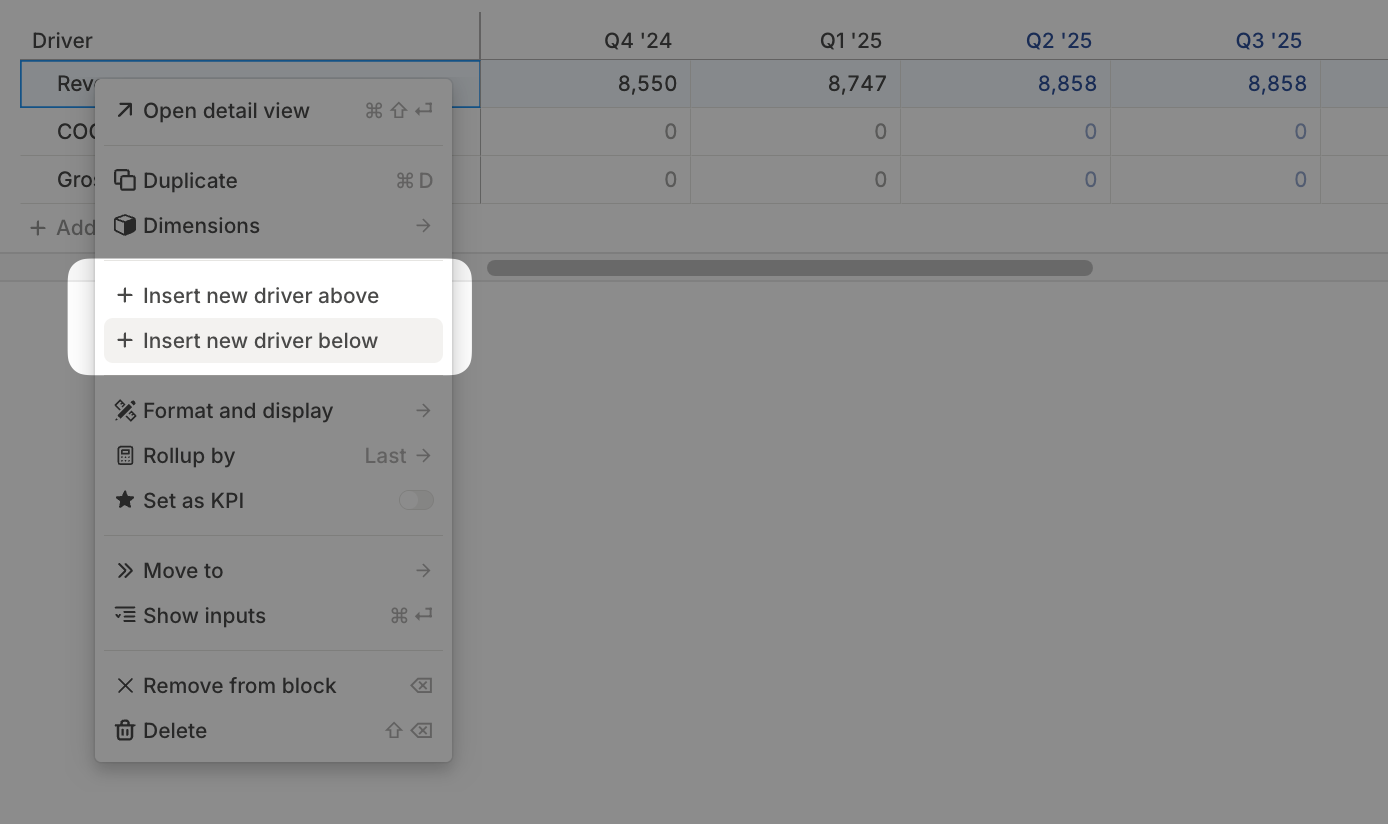
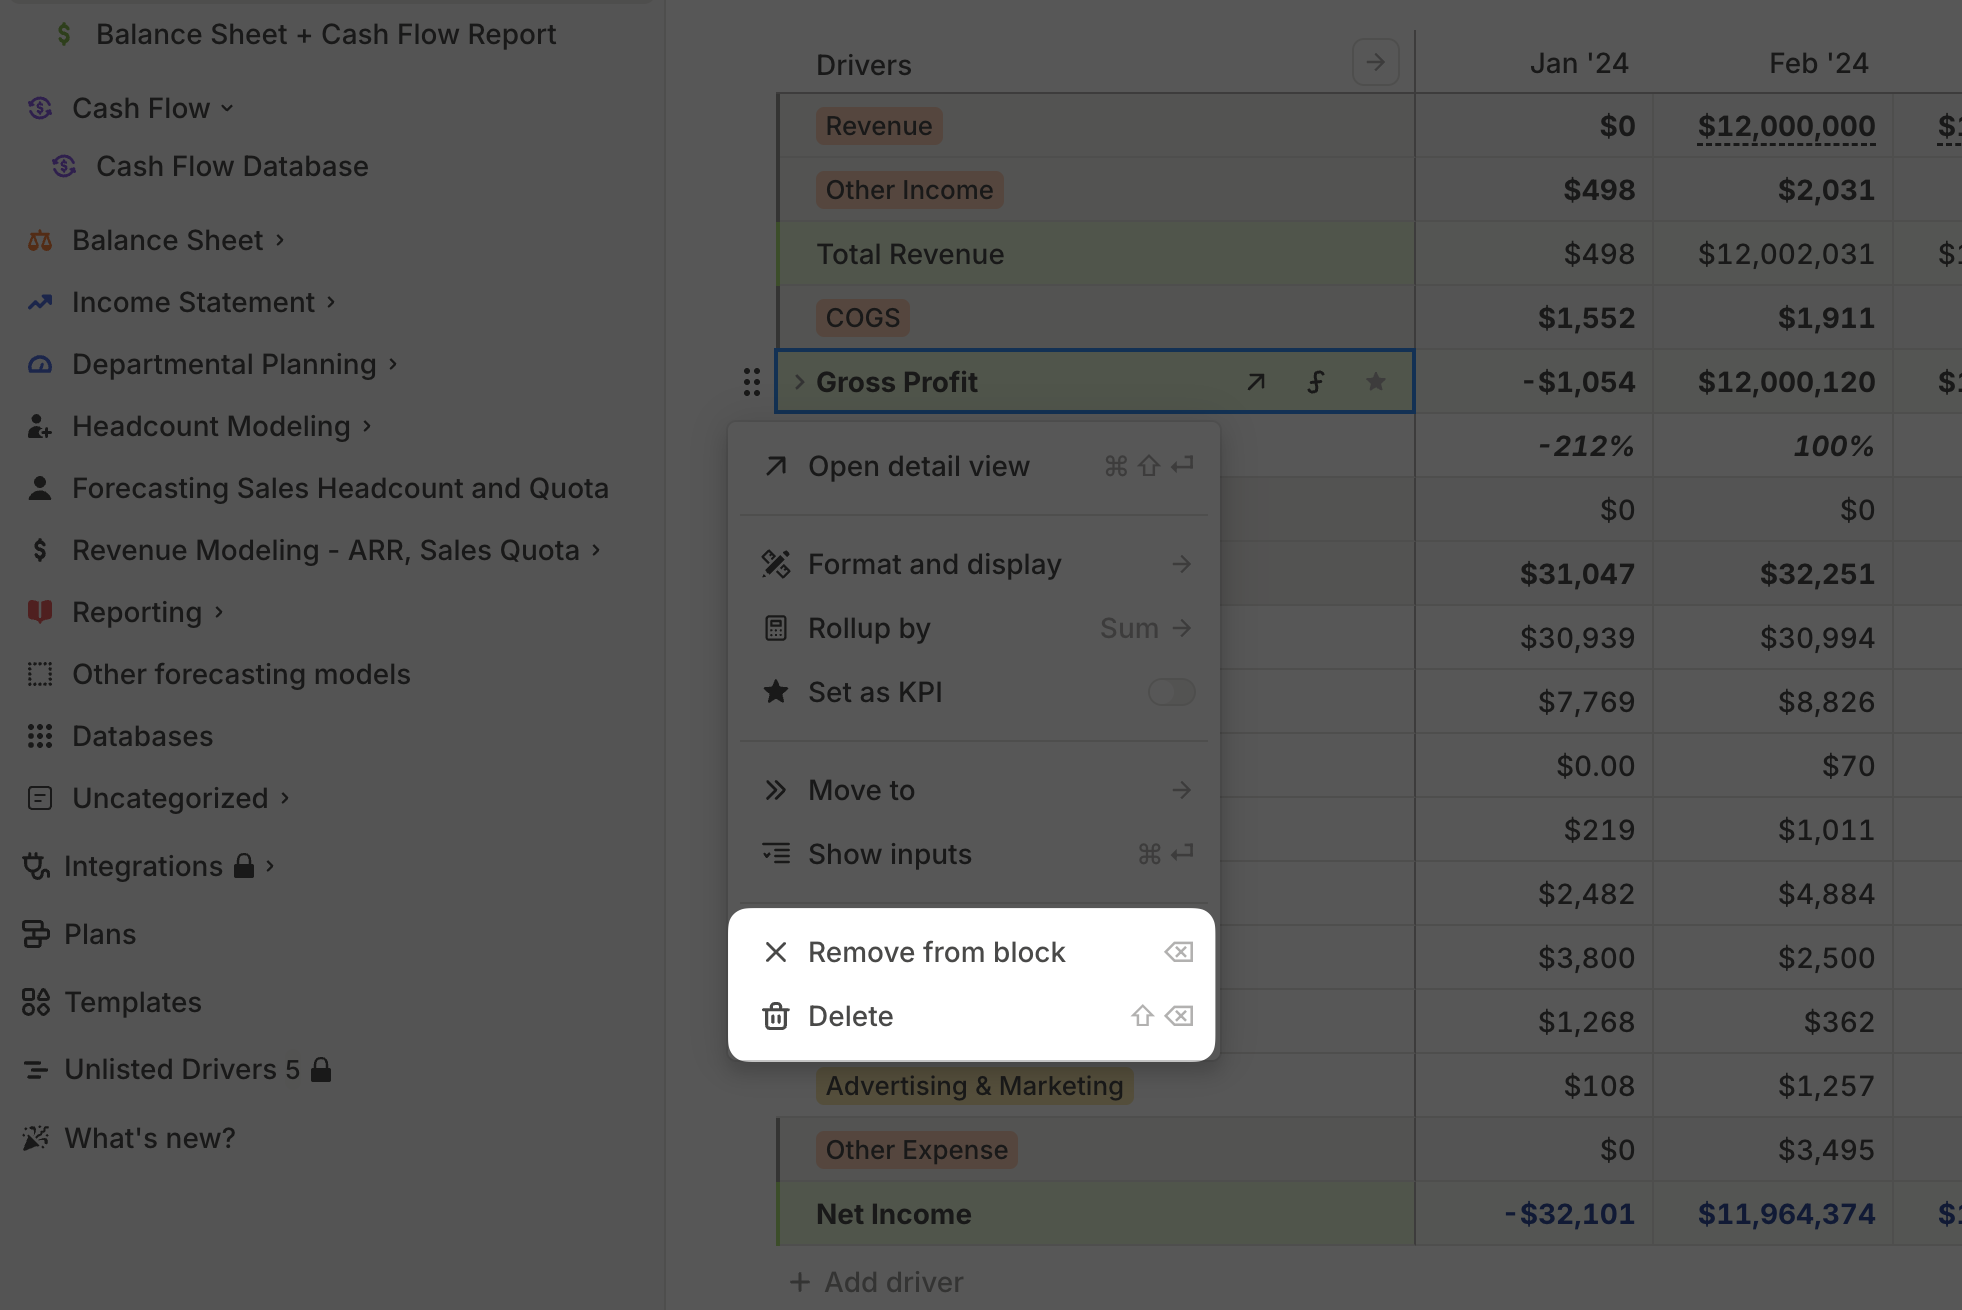
Removing a driver from the block does not delete it from Runway. It only removes that driver from this table. See Duplicating, removing & deleting for details.
Formatting drivers
Drivers retain their existing formatting when added to a table on a page. You can adjust color, text style, indentation, precision, and other formatting, but those changes apply globally wherever the driver appears. For more details, see Driver formatting.Time period rollups
Selecting the time period
By default, data in a driver table block is displayed monthly, with each month as a separate column. Use rollups when you want to show quarters, years, or custom ranges.1
Open Rollups
Click Customize in the top-right corner, then select Rollups.
2
Choose a rollup
Choose Monthly, Quarterly, Annual, a combined monthly/quarterly/annual view, or Custom rollup.
3
Use custom options when needed
Custom rollups include quarter-to-date, half-year-to-date, year-to-date, quarter-to-last-close, half-year-to-last-close, year-to-last-close, and trailing 3, 6, or 12 months.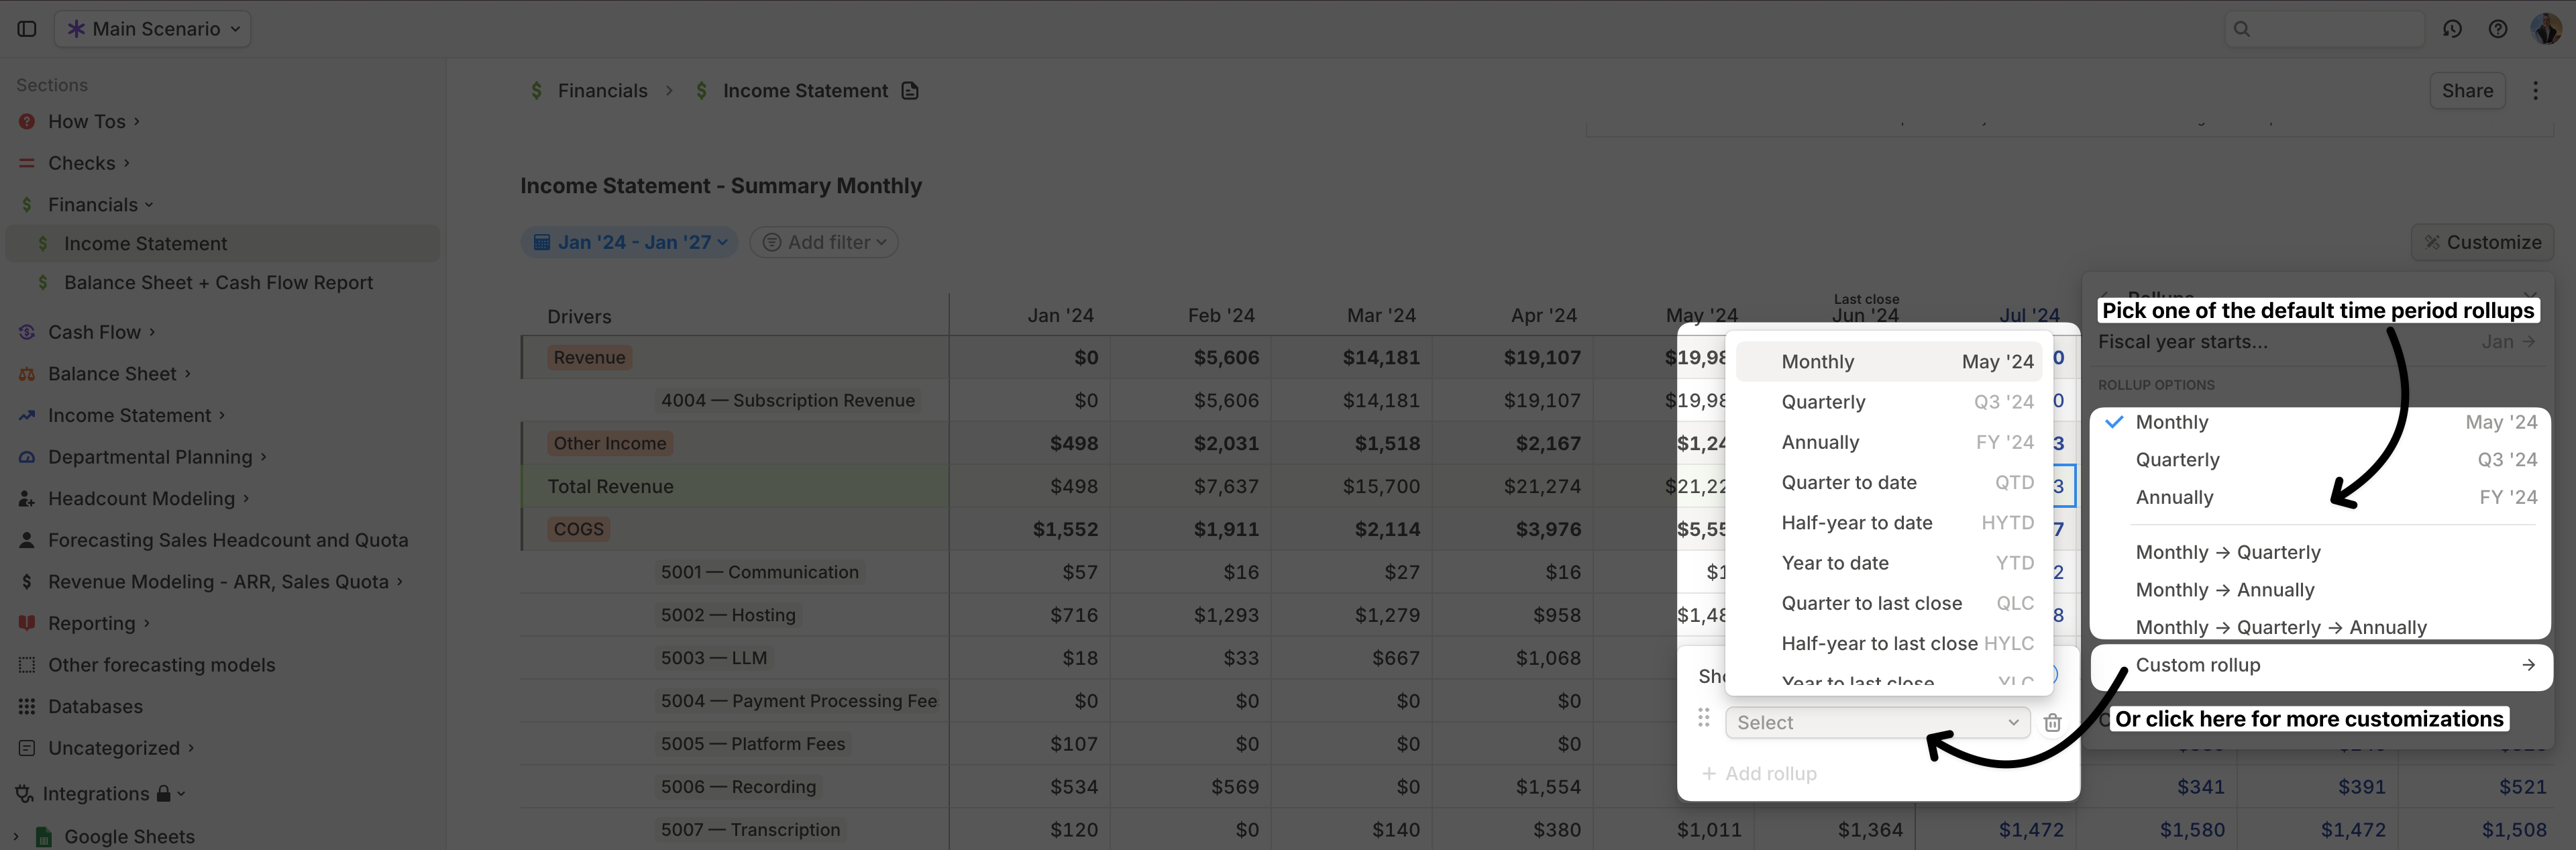
Selecting the aggregation
Each driver can define how values aggregate into a coarser time period.1
Open Roll up by
Right-click the driver name and select Roll up by.
2
Choose an aggregation
Choose Sum, Average, First, or Last.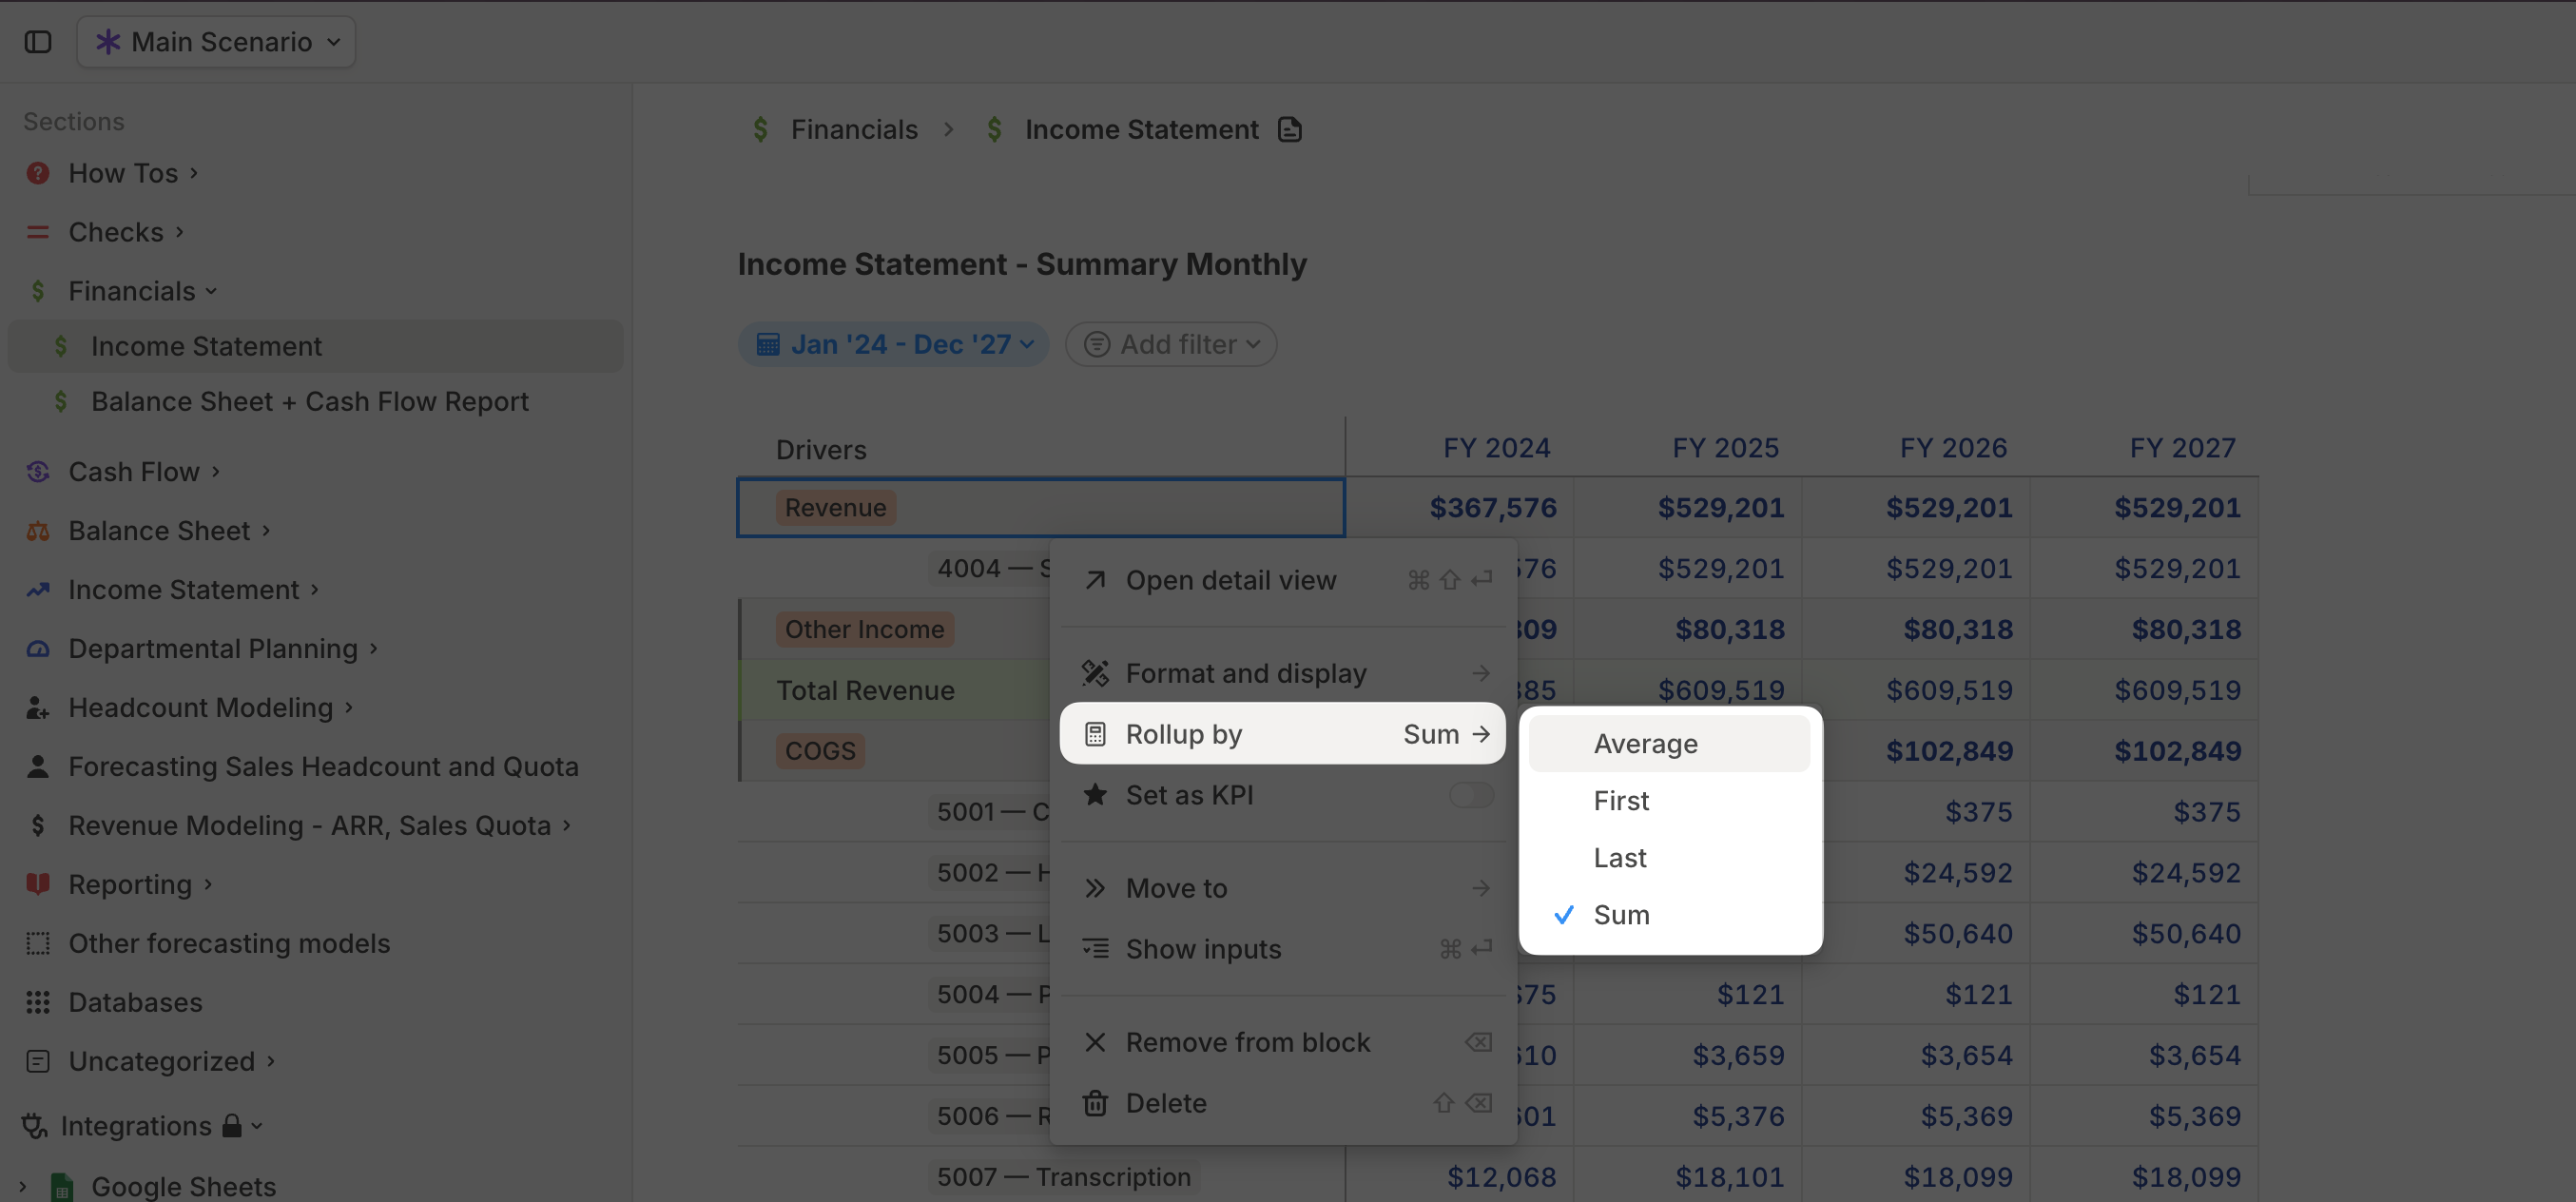
1
Show the Rollup column
Click Customize > Properties, then enable Rollup.
2
Edit in the table
Click the Rollup cell for a driver and choose its aggregation method.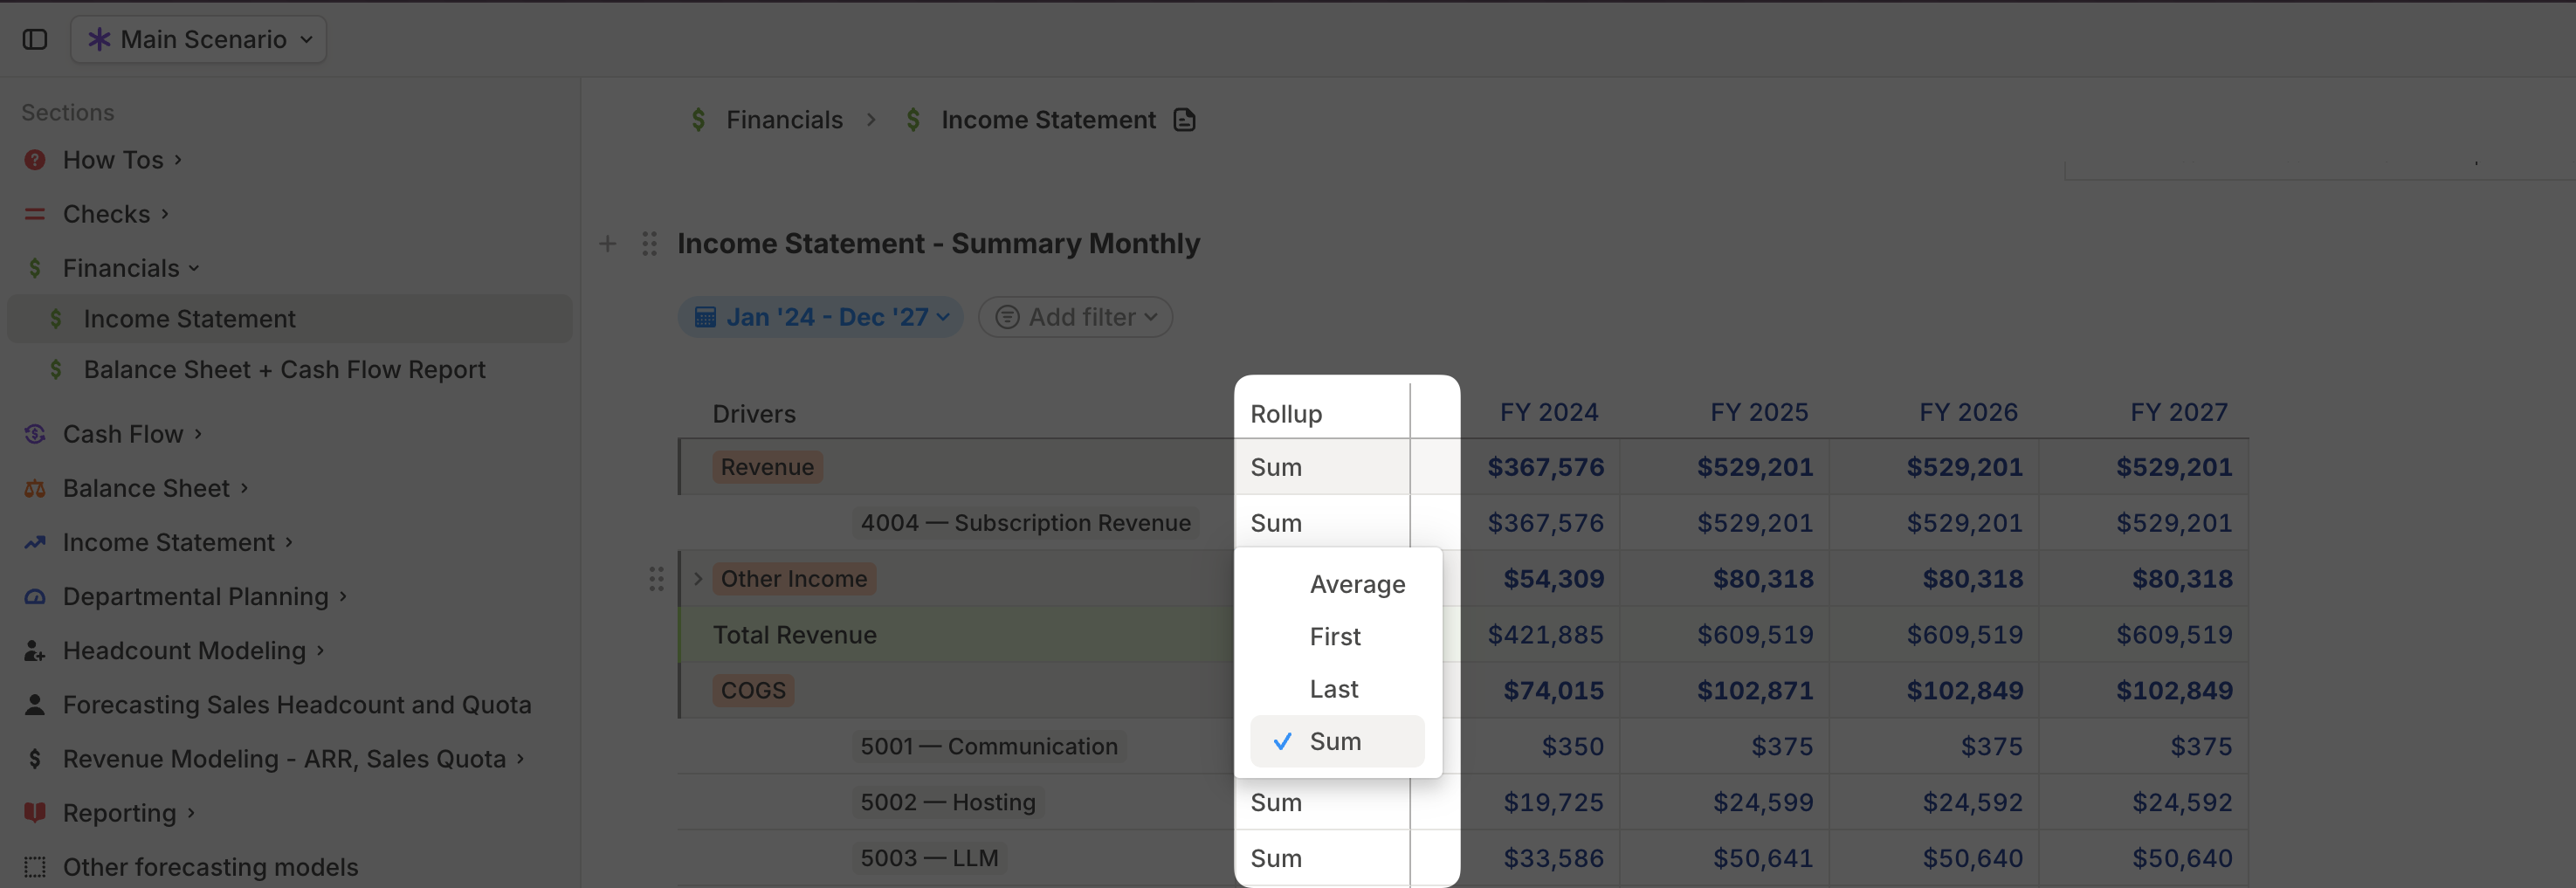
Comparing drivers across scenarios
1
Open Compare
Click Customize in the top-right corner.
2
Choose scenarios
Select Compare, then choose the scenarios you want to compare.
Comparing drivers across time periods
In driver tables, you can compare values over time, such as month-over-month, quarter-over-quarter, or year-over-year.1
Open time period comparison
Click Customize, then go to Compare > Time period.
2
Choose a comparison window
Choose Previous period, 3 months ago, 6 months ago, or 12 months ago.
3
Choose metrics
Pick Value, Variance, Variance %, or a combination.
4
Review the rows
Each comparison appears as a new row below the original driver.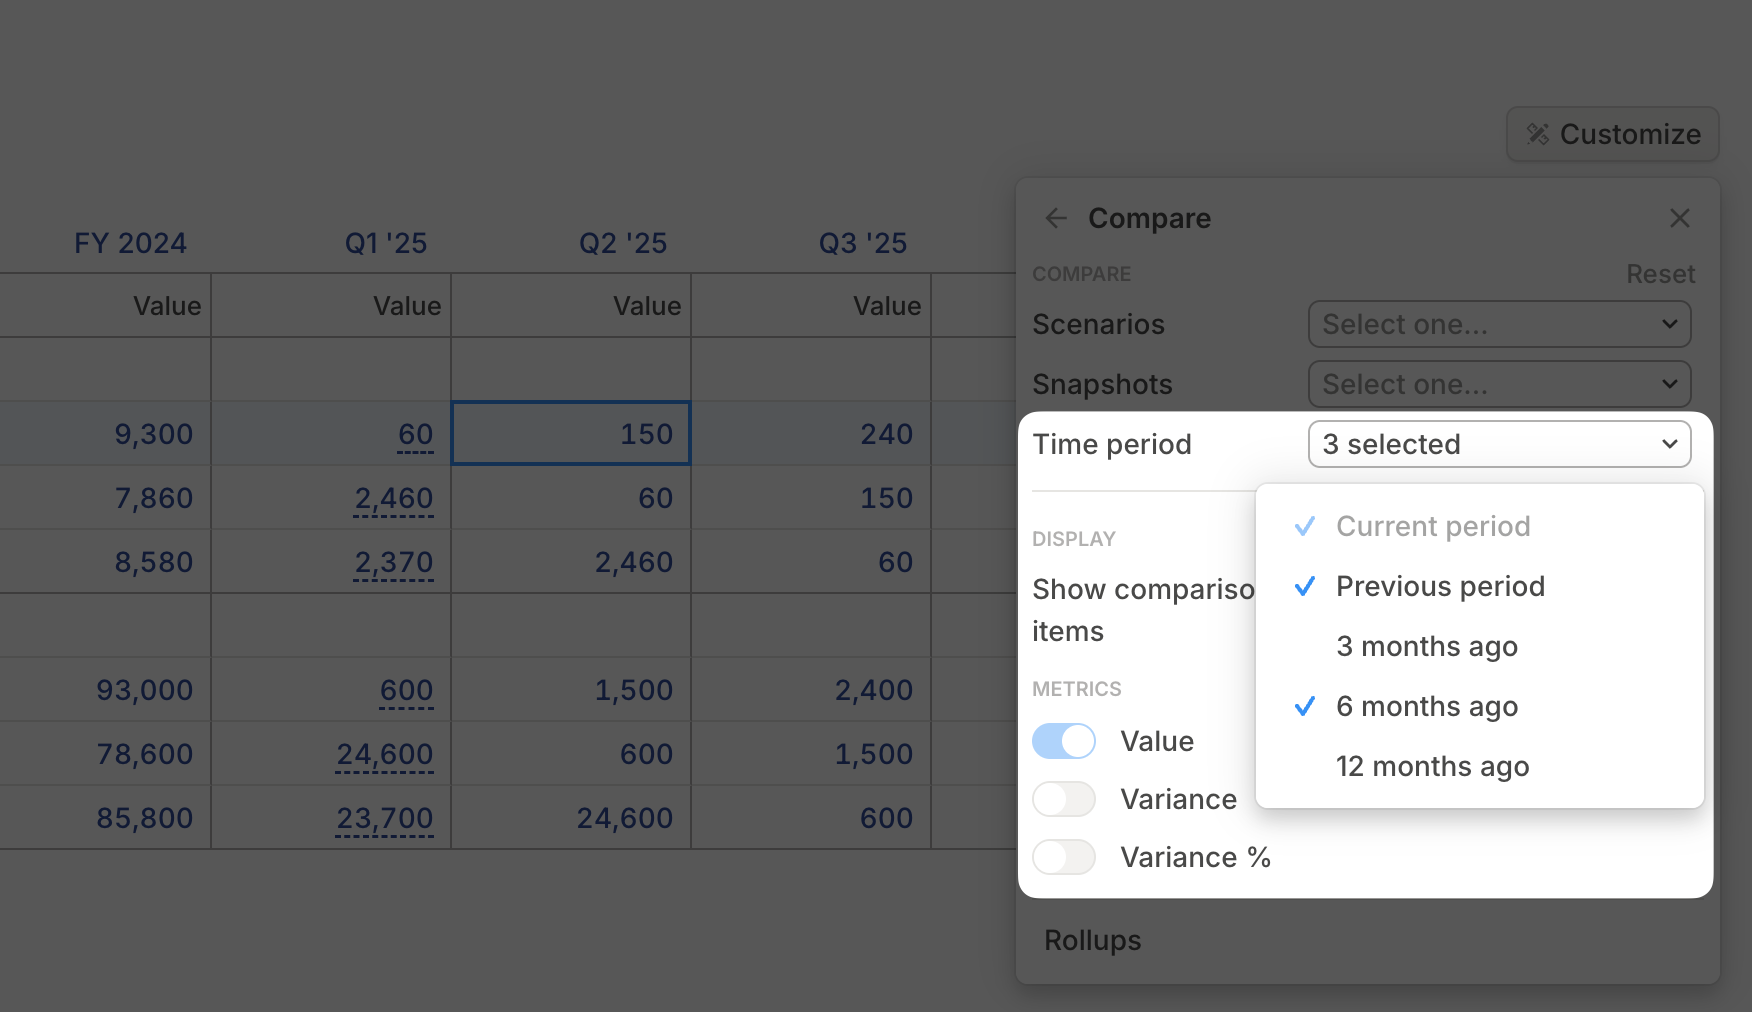
Drivers table FAQ
Can time period comparisons be displayed as columns instead of rows?
Can time period comparisons be displayed as columns instead of rows?
No. Time period comparisons are displayed as rows.