

Terms
Table blocks
A mini spreadsheet built into CFO.ai — each report or forecast you build lives in its own table block.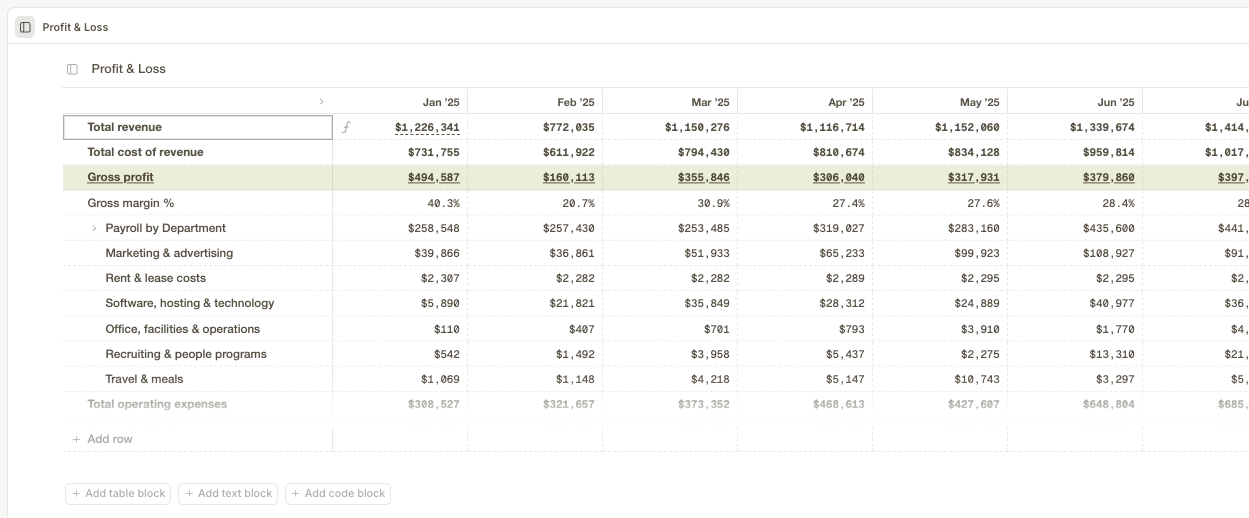
Integrations
The connections that pull your data in automatically — QuickBooks, Xero, NetSuite, Sheets, and CSV files.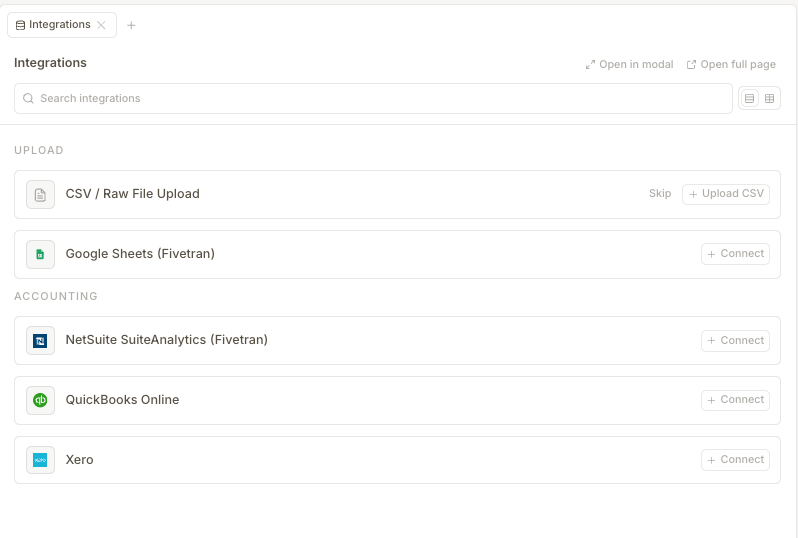
Scenarios
Different “what if” versions of your plan, so you can compare outcomes before deciding what to do.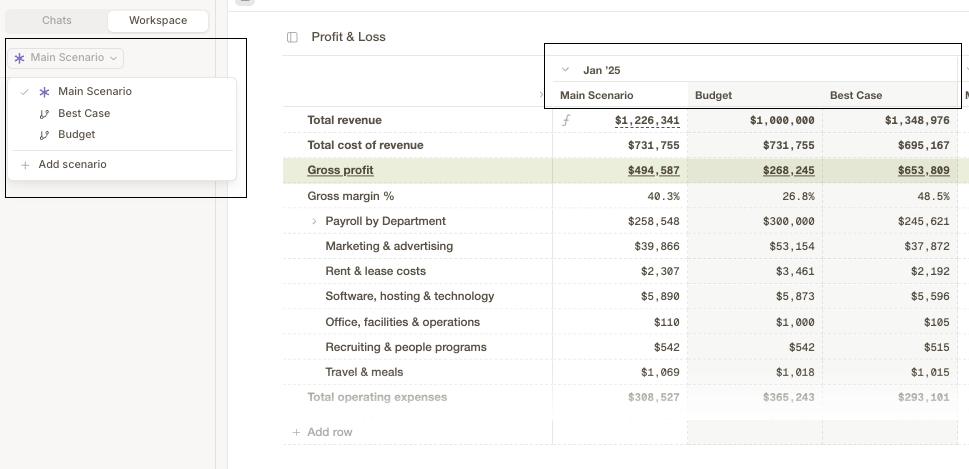
Page
A single screen inside CFO.ai focused on one topic — like a folder or tab in your workspace.
Database
An organized list of similar items, like contacts or expenses, made up of rows and columns.
Metrics
The key numbers you track to understand the business — cash, burn, revenue, and more.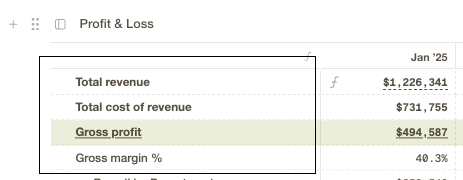
Rows
A single line of data in a table block, like an expense category, vendor, or line item.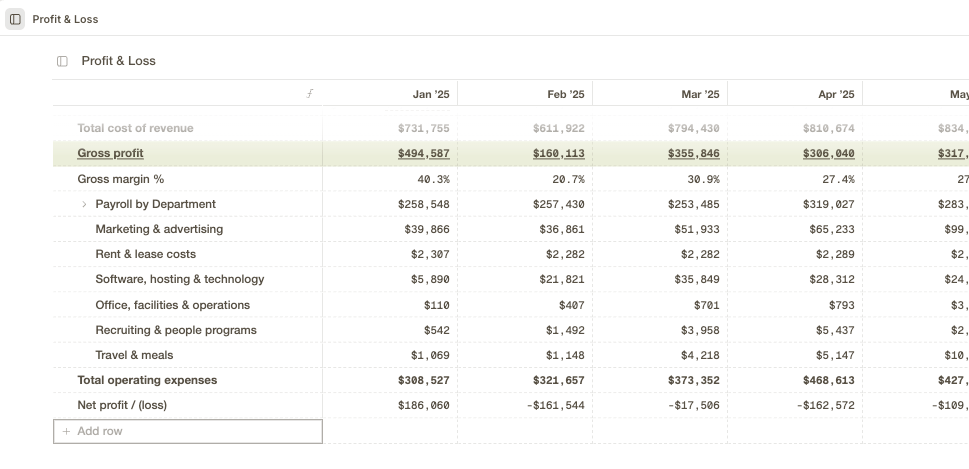
Still not sure what a term means?
Just ask CFO.ai directly, in your own words.Ask Ari
Get instant answers from our AI assistant.