> ## Documentation Index
> Fetch the complete documentation index at: https://runway-docs.cfo.ai/llms.txt
> Use this file to discover all available pages before exploring further.
# Databases basics
> Databases store raw and modeled business data in rows, then make that data available to drivers, formulas, pages, and reports.
Databases are where source data becomes structured model data. Use a database when you need rows of real things, such as transactions, employees, deals, vendors, or assumptions, that can be segmented, rolled up, and referenced by drivers.
## What is a database?
When you connect an integration, your data flows into a database. You can then create additional databases that pull from the original database and aggregate the data at different levels. For example, if you import GL data with vendor-level details from QuickBooks, NetSuite, or Xero, you can build another database that rolls it up by department or class.
## Creating a database
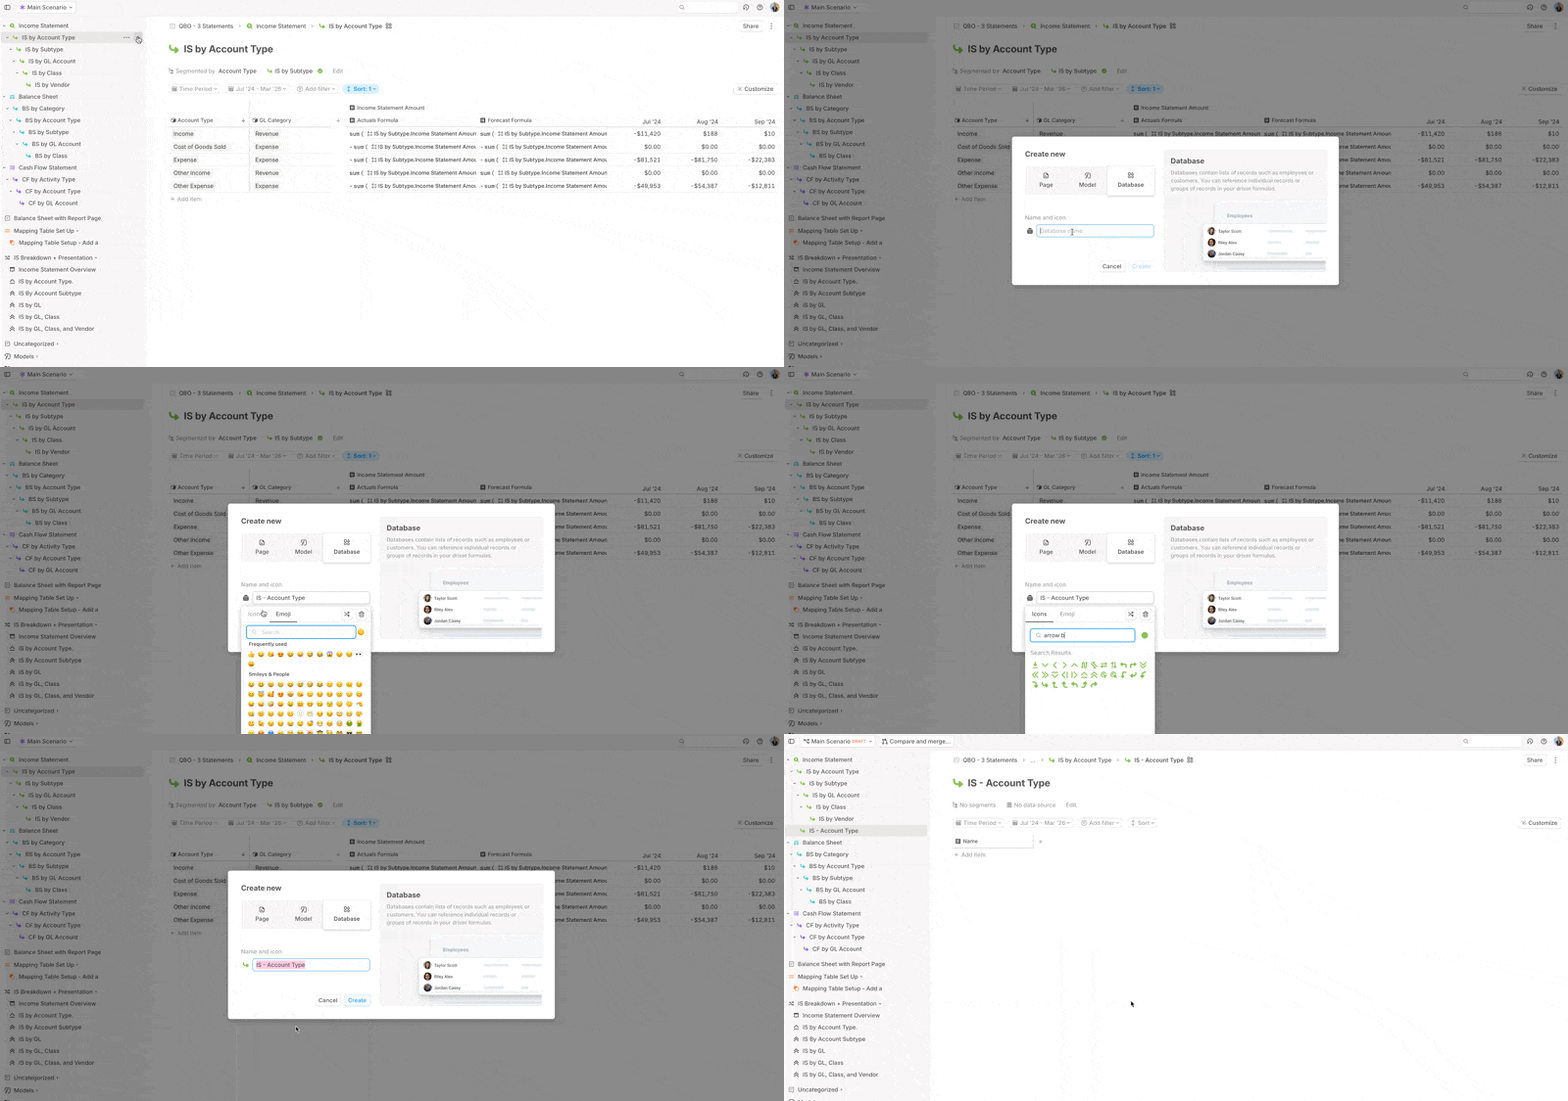
Click the **+** button next to a section or page in the sidebar.
Select **Database** and give it a clear name, icon, or emoji.
 ## Configuring a database
After creating a database, configure the source, drivers, and segmentation that determine its grain.
Click the **configuration** header to expand it.
Select an existing integration query or another database.
Choose the key metrics or dates you want to track as time series data.
Select the dimensions to segment your data. Segmentation determines the database's granularity.
Add useful metadata from the data source under **Other columns**.
For example, if you are pulling in GL data at the most granular level, you might select **Amount** as the driver, use **Account Name**, **Class**, and **Vendor** as dimensions, and include **Account Type** under **Other columns**.
## Configuring a database
After creating a database, configure the source, drivers, and segmentation that determine its grain.
Click the **configuration** header to expand it.
Select an existing integration query or another database.
Choose the key metrics or dates you want to track as time series data.
Select the dimensions to segment your data. Segmentation determines the database's granularity.
Add useful metadata from the data source under **Other columns**.
For example, if you are pulling in GL data at the most granular level, you might select **Amount** as the driver, use **Account Name**, **Class**, and **Vendor** as dimensions, and include **Account Type** under **Other columns**.
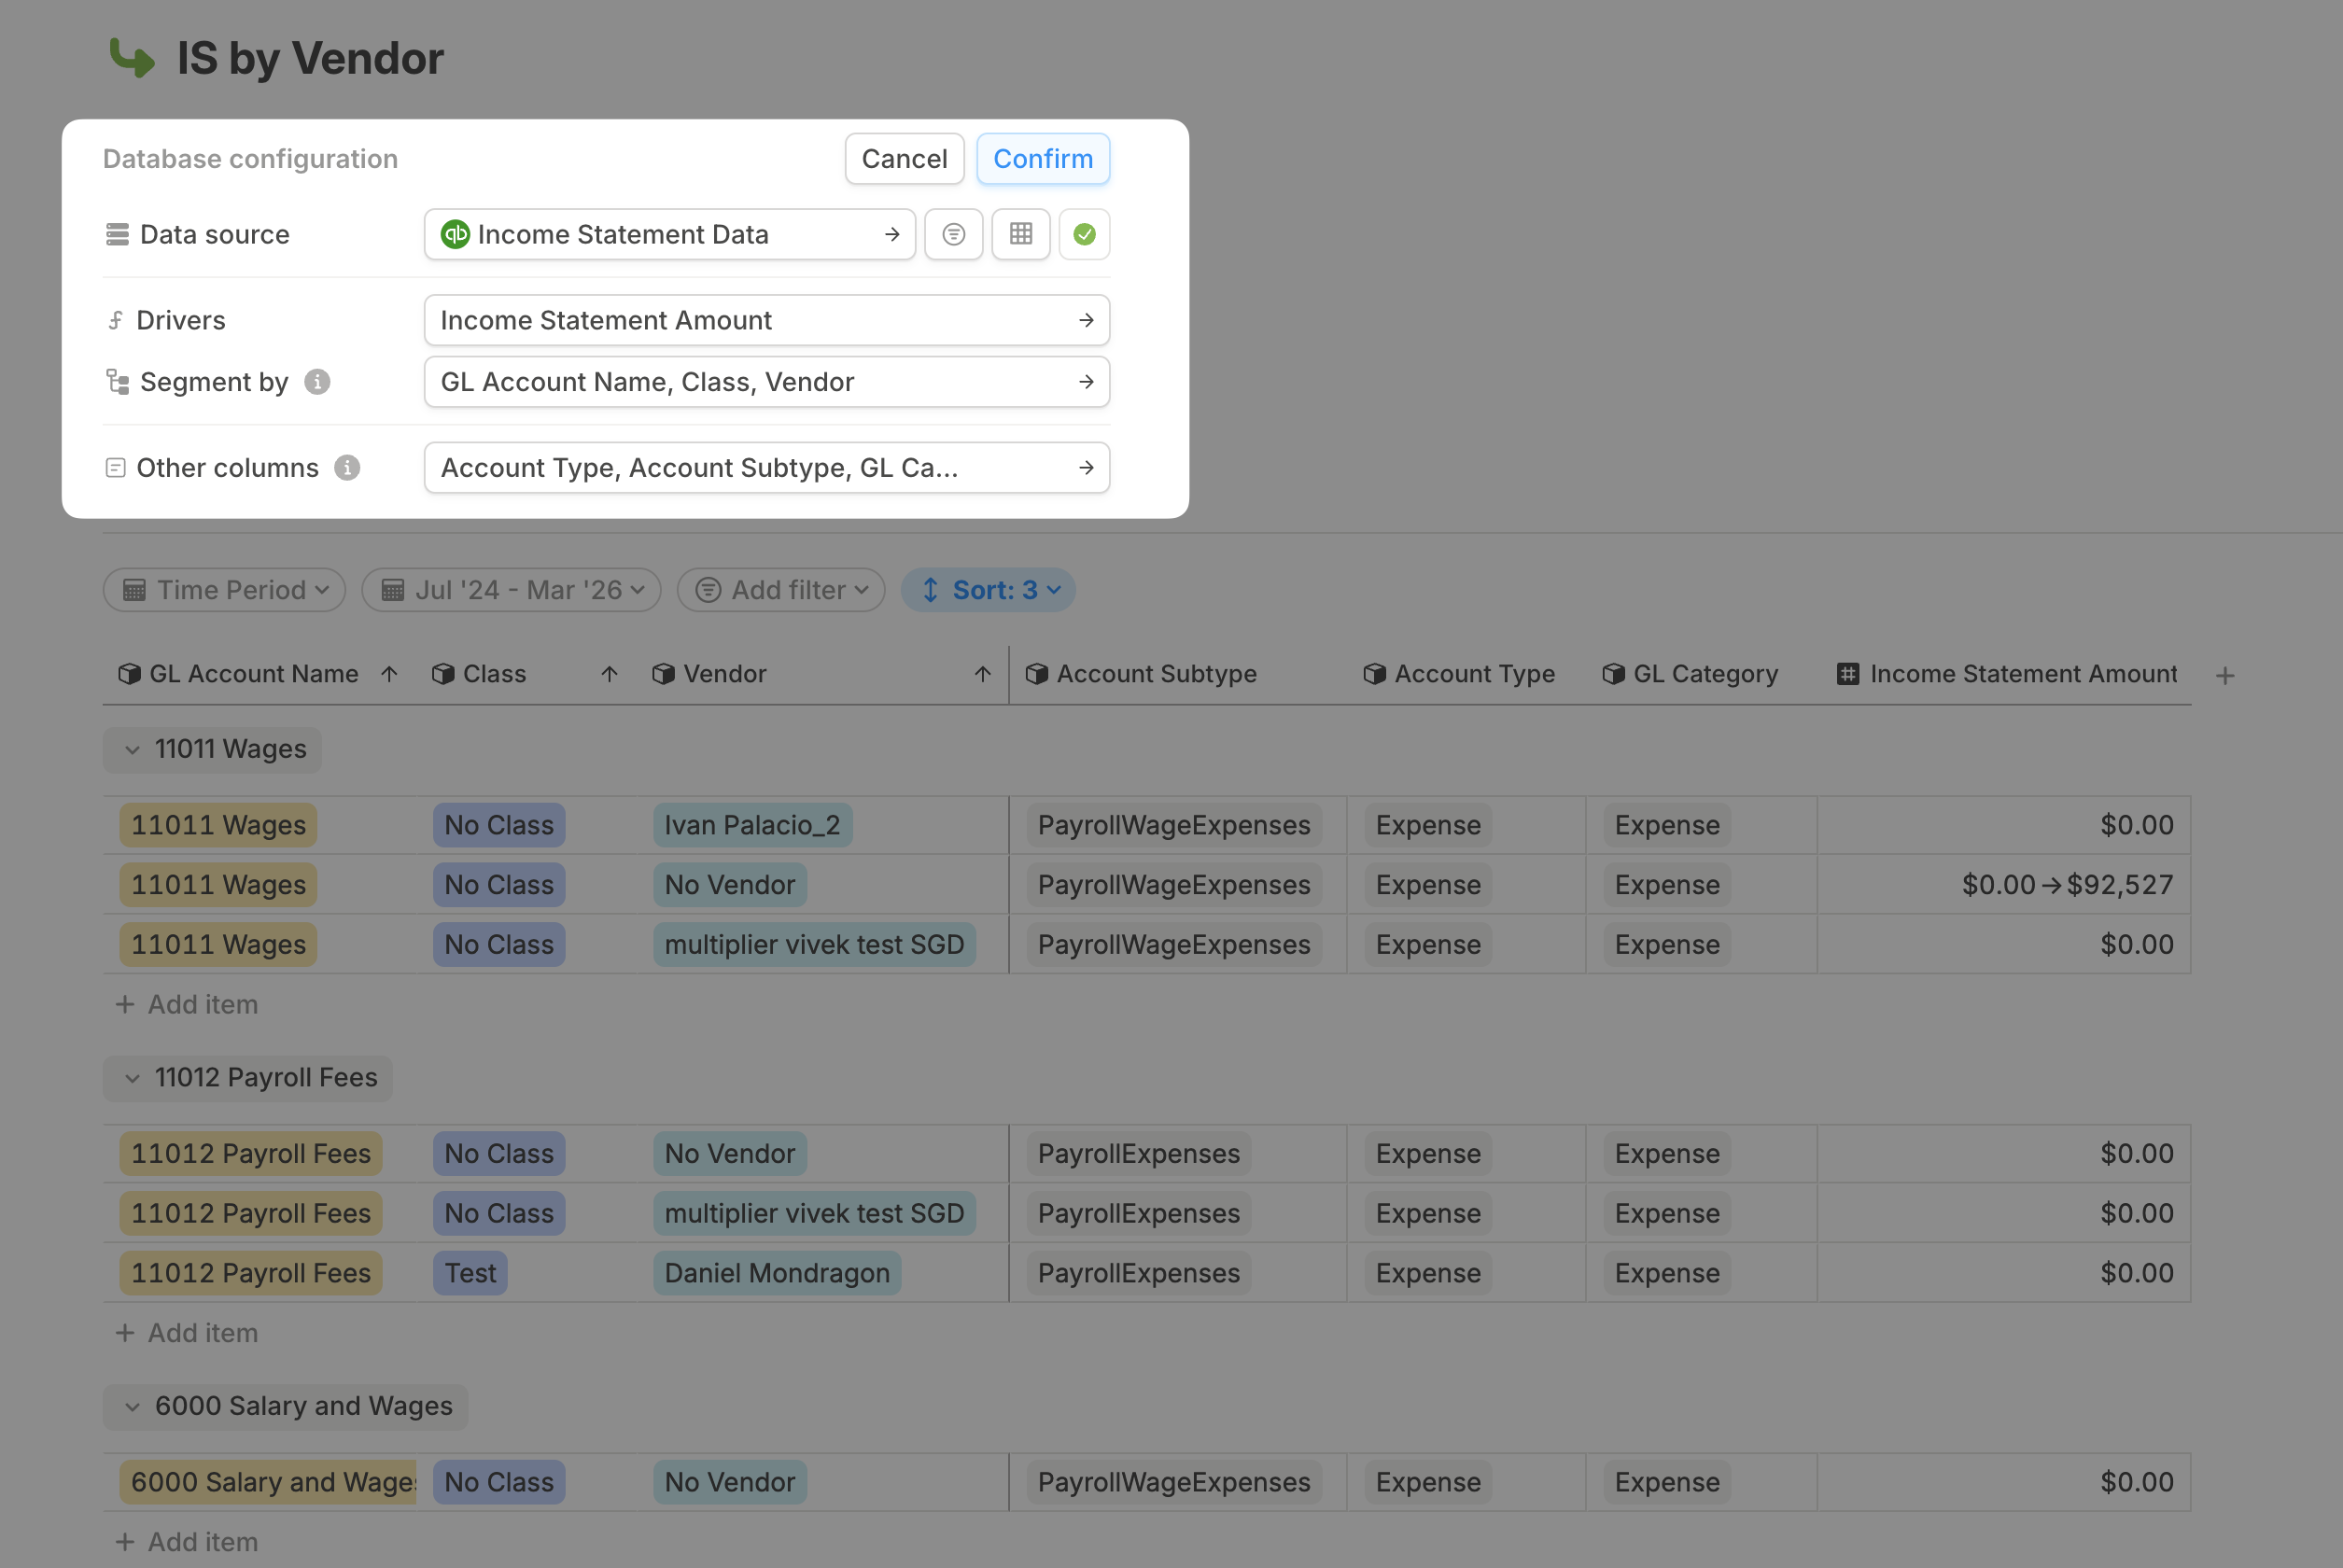 The dimensions you use to segment your data appear alongside the driver name across the app, including in tables and charts. To improve readability, use only the dimensions needed to define the database's grain. Add extra metadata under **Other columns** instead.
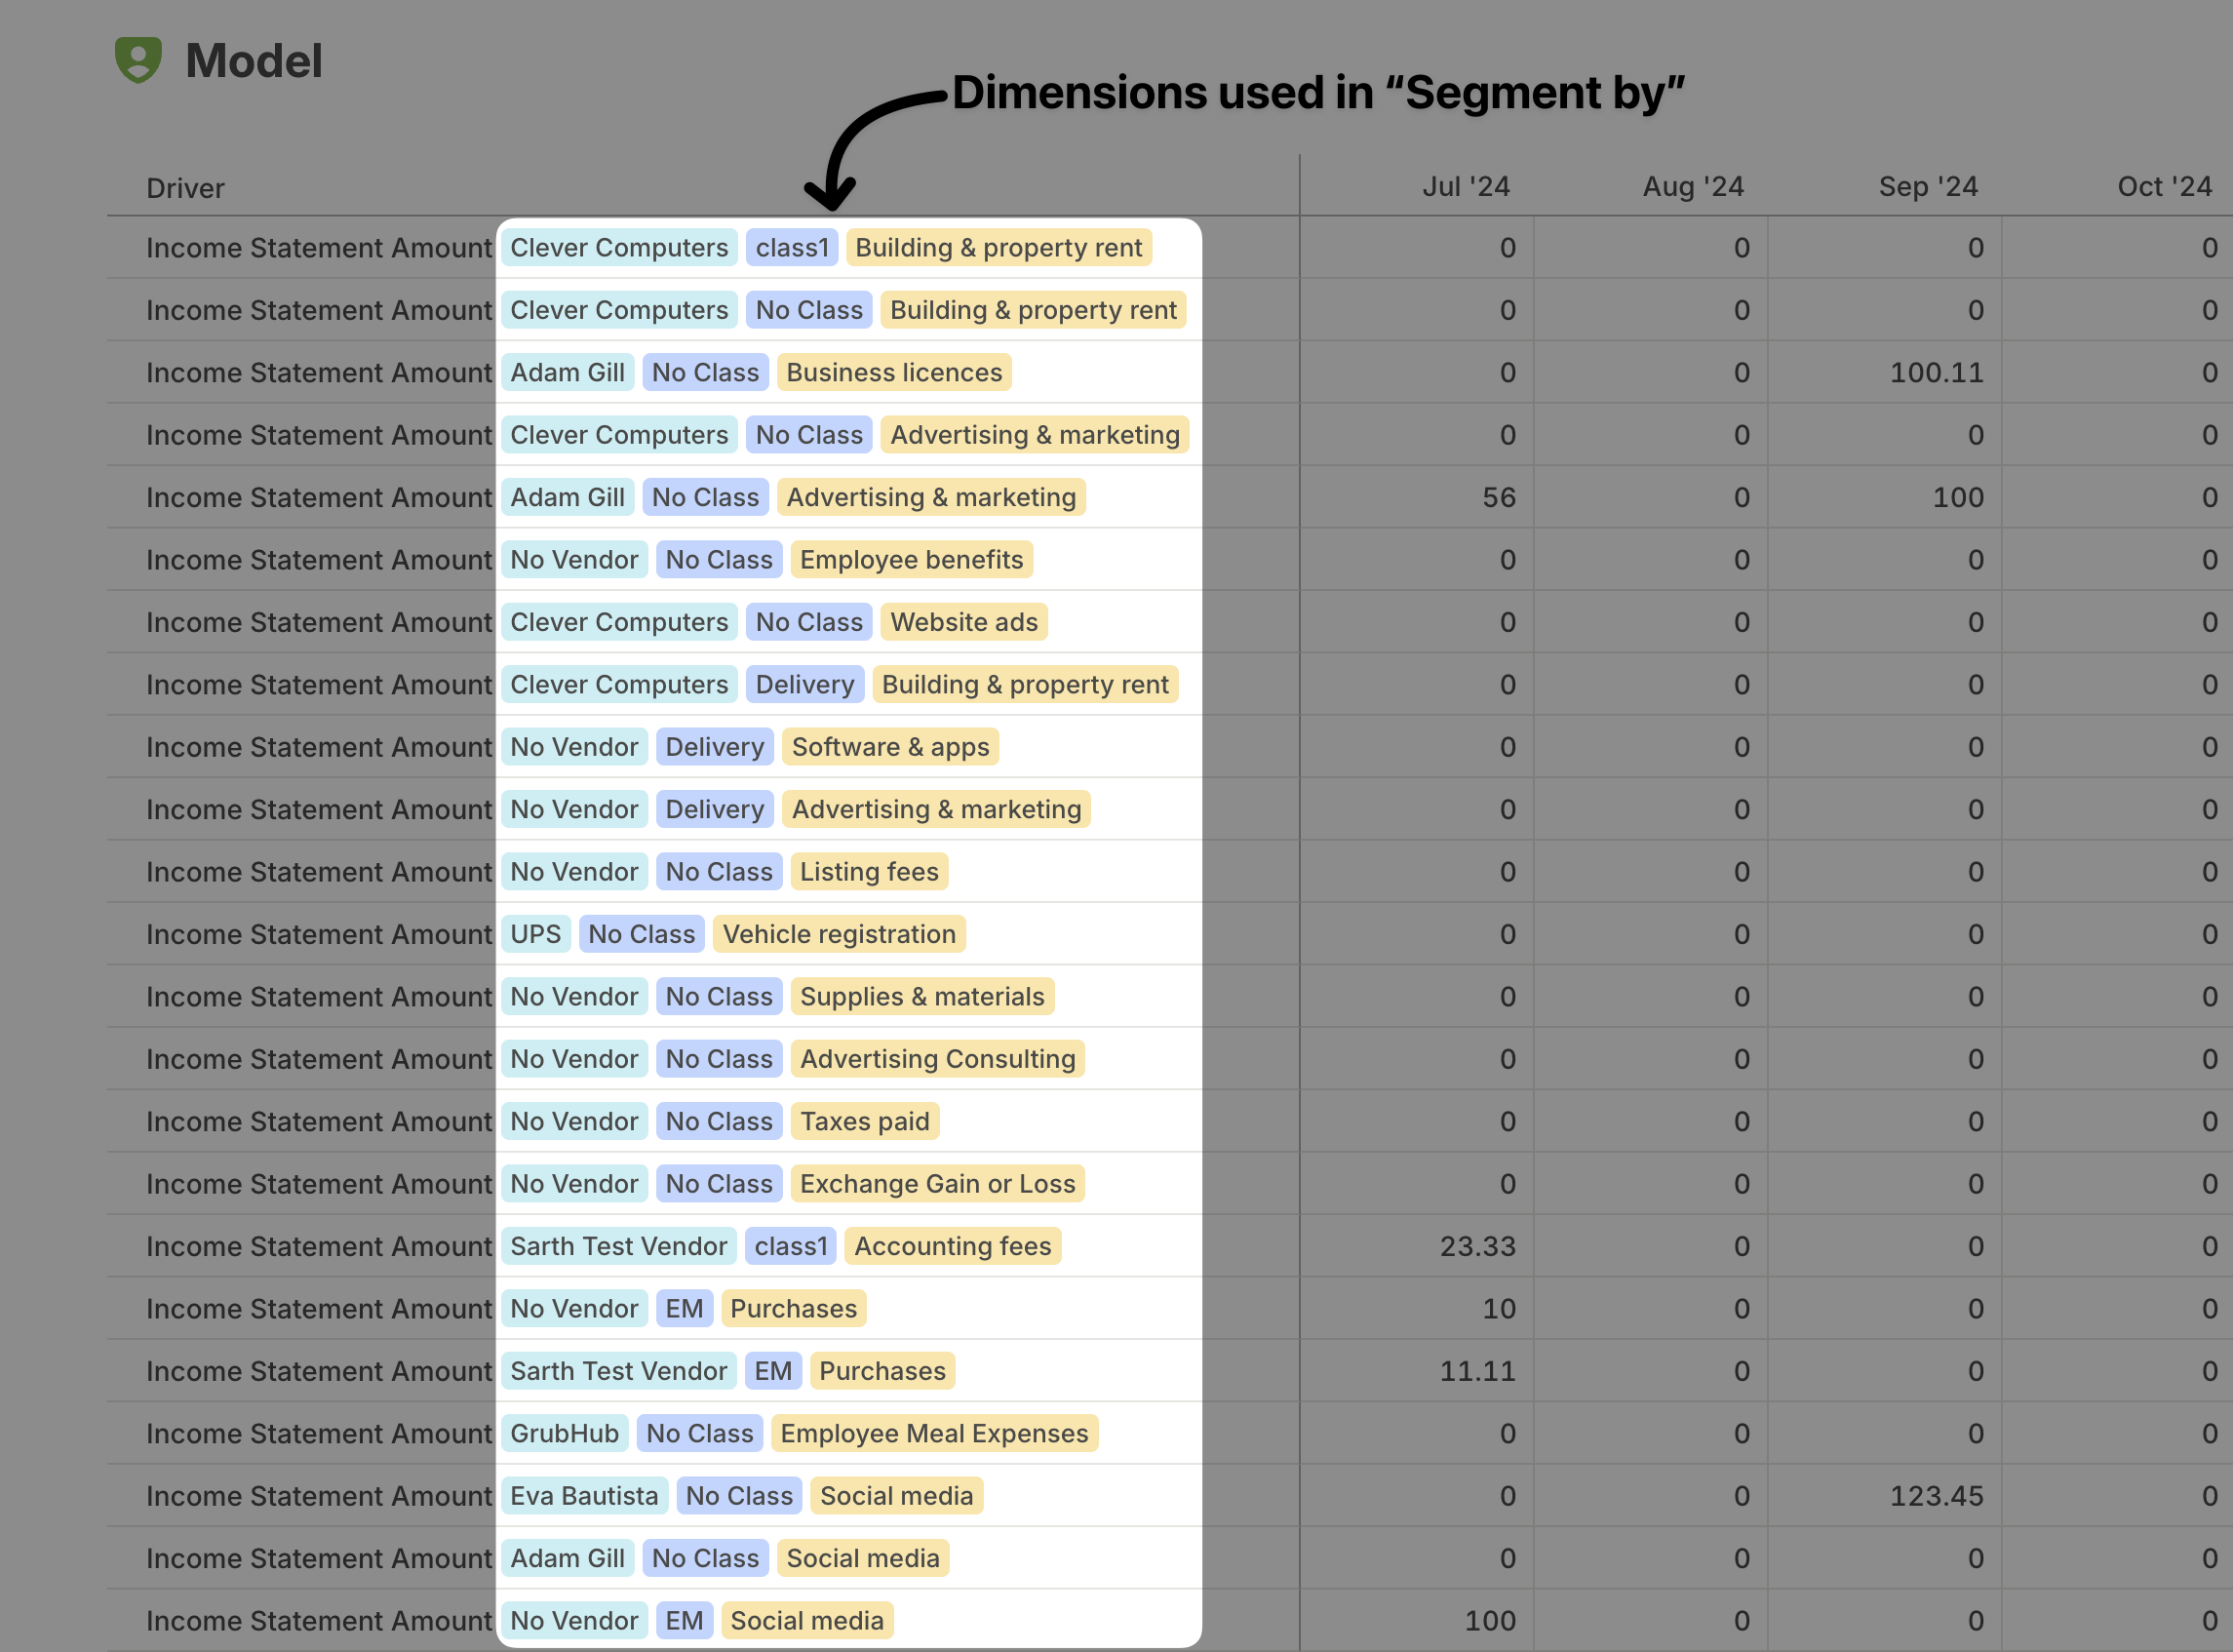 To inspect the structure of your source data before confirming the database, use the preview table.
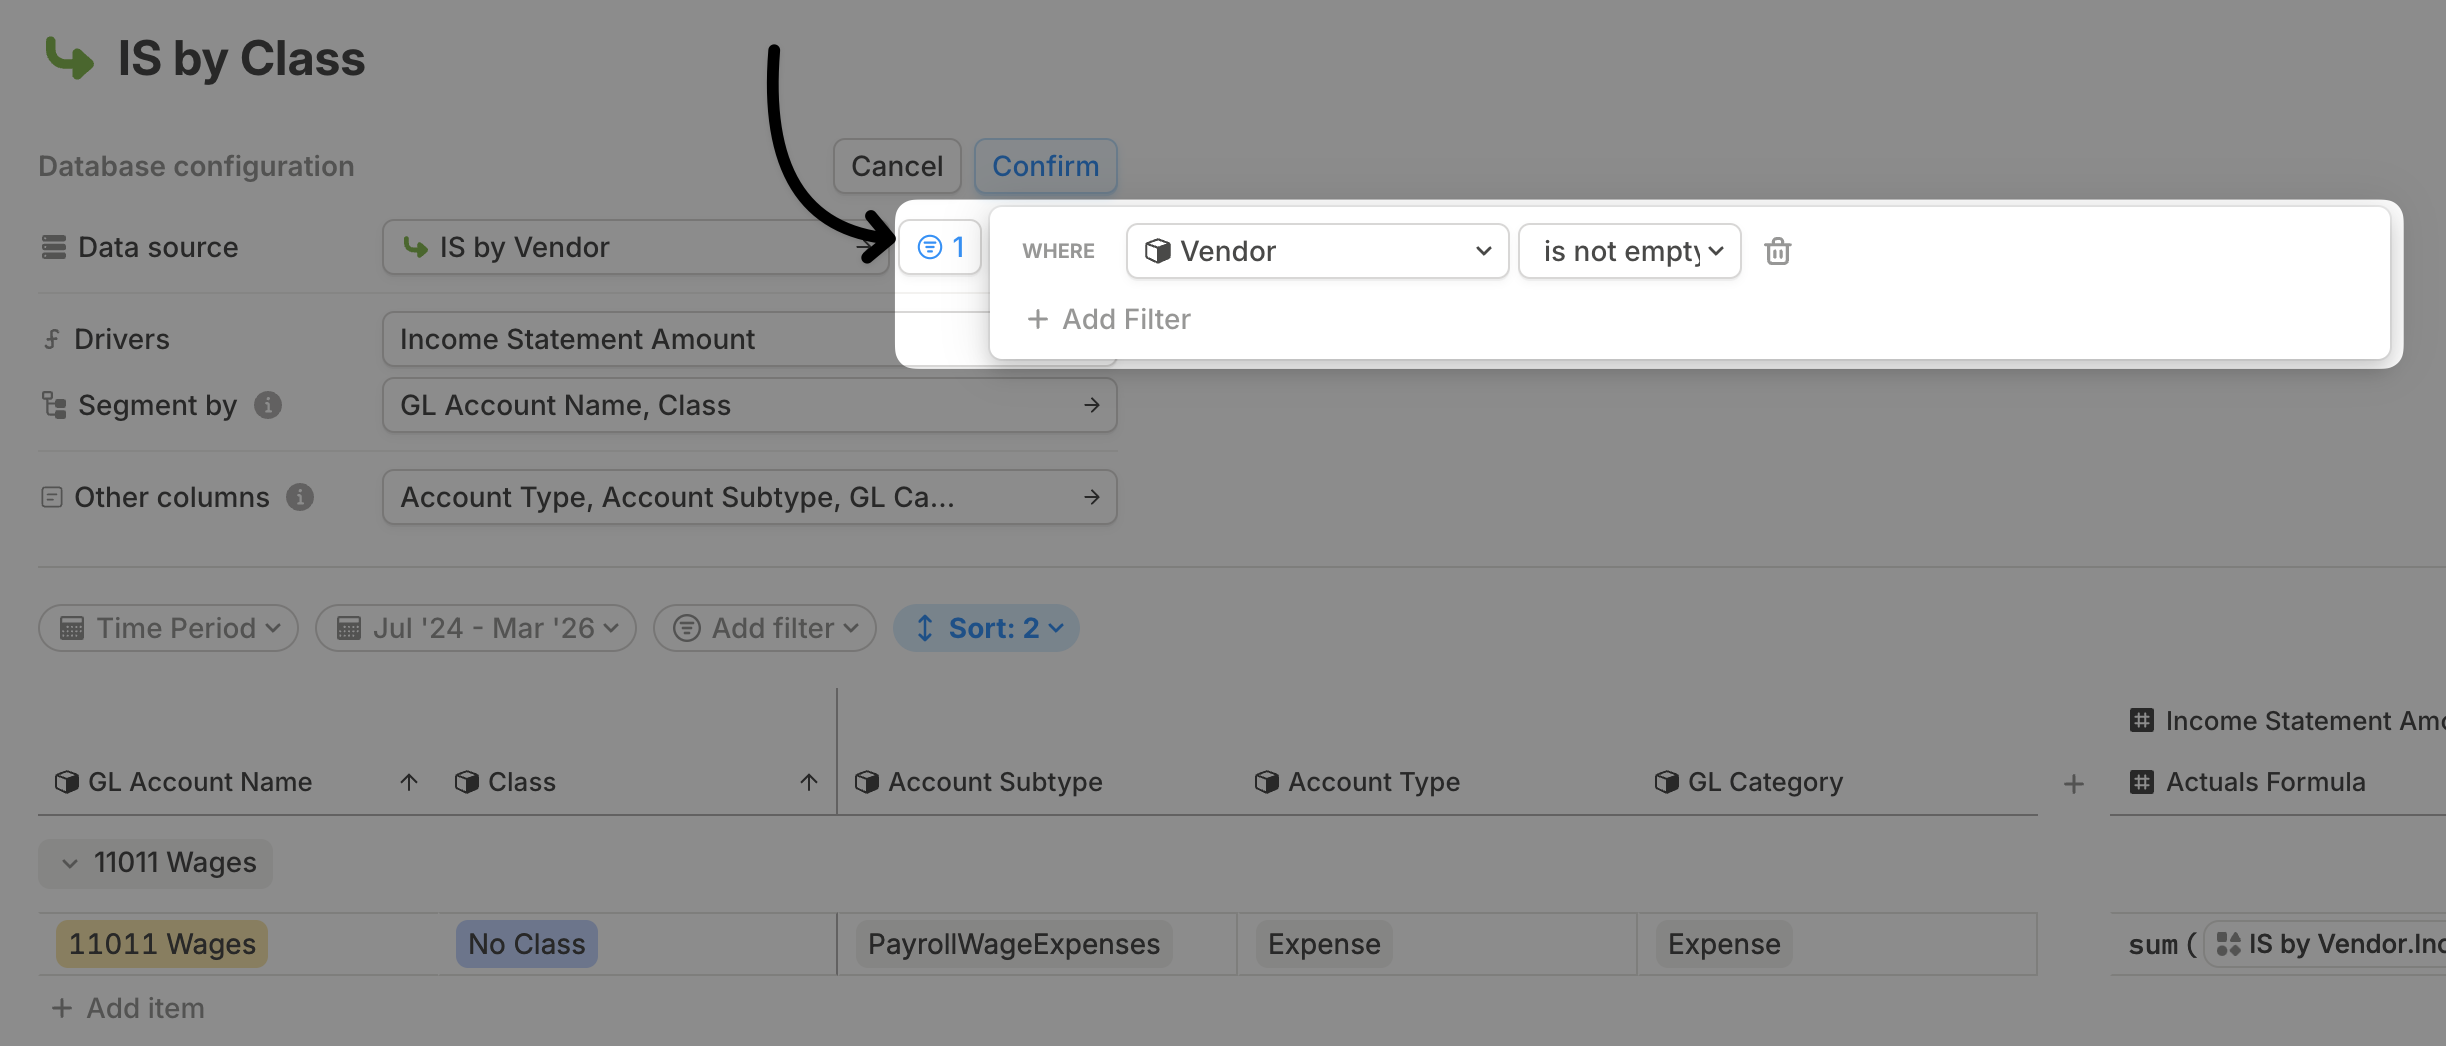
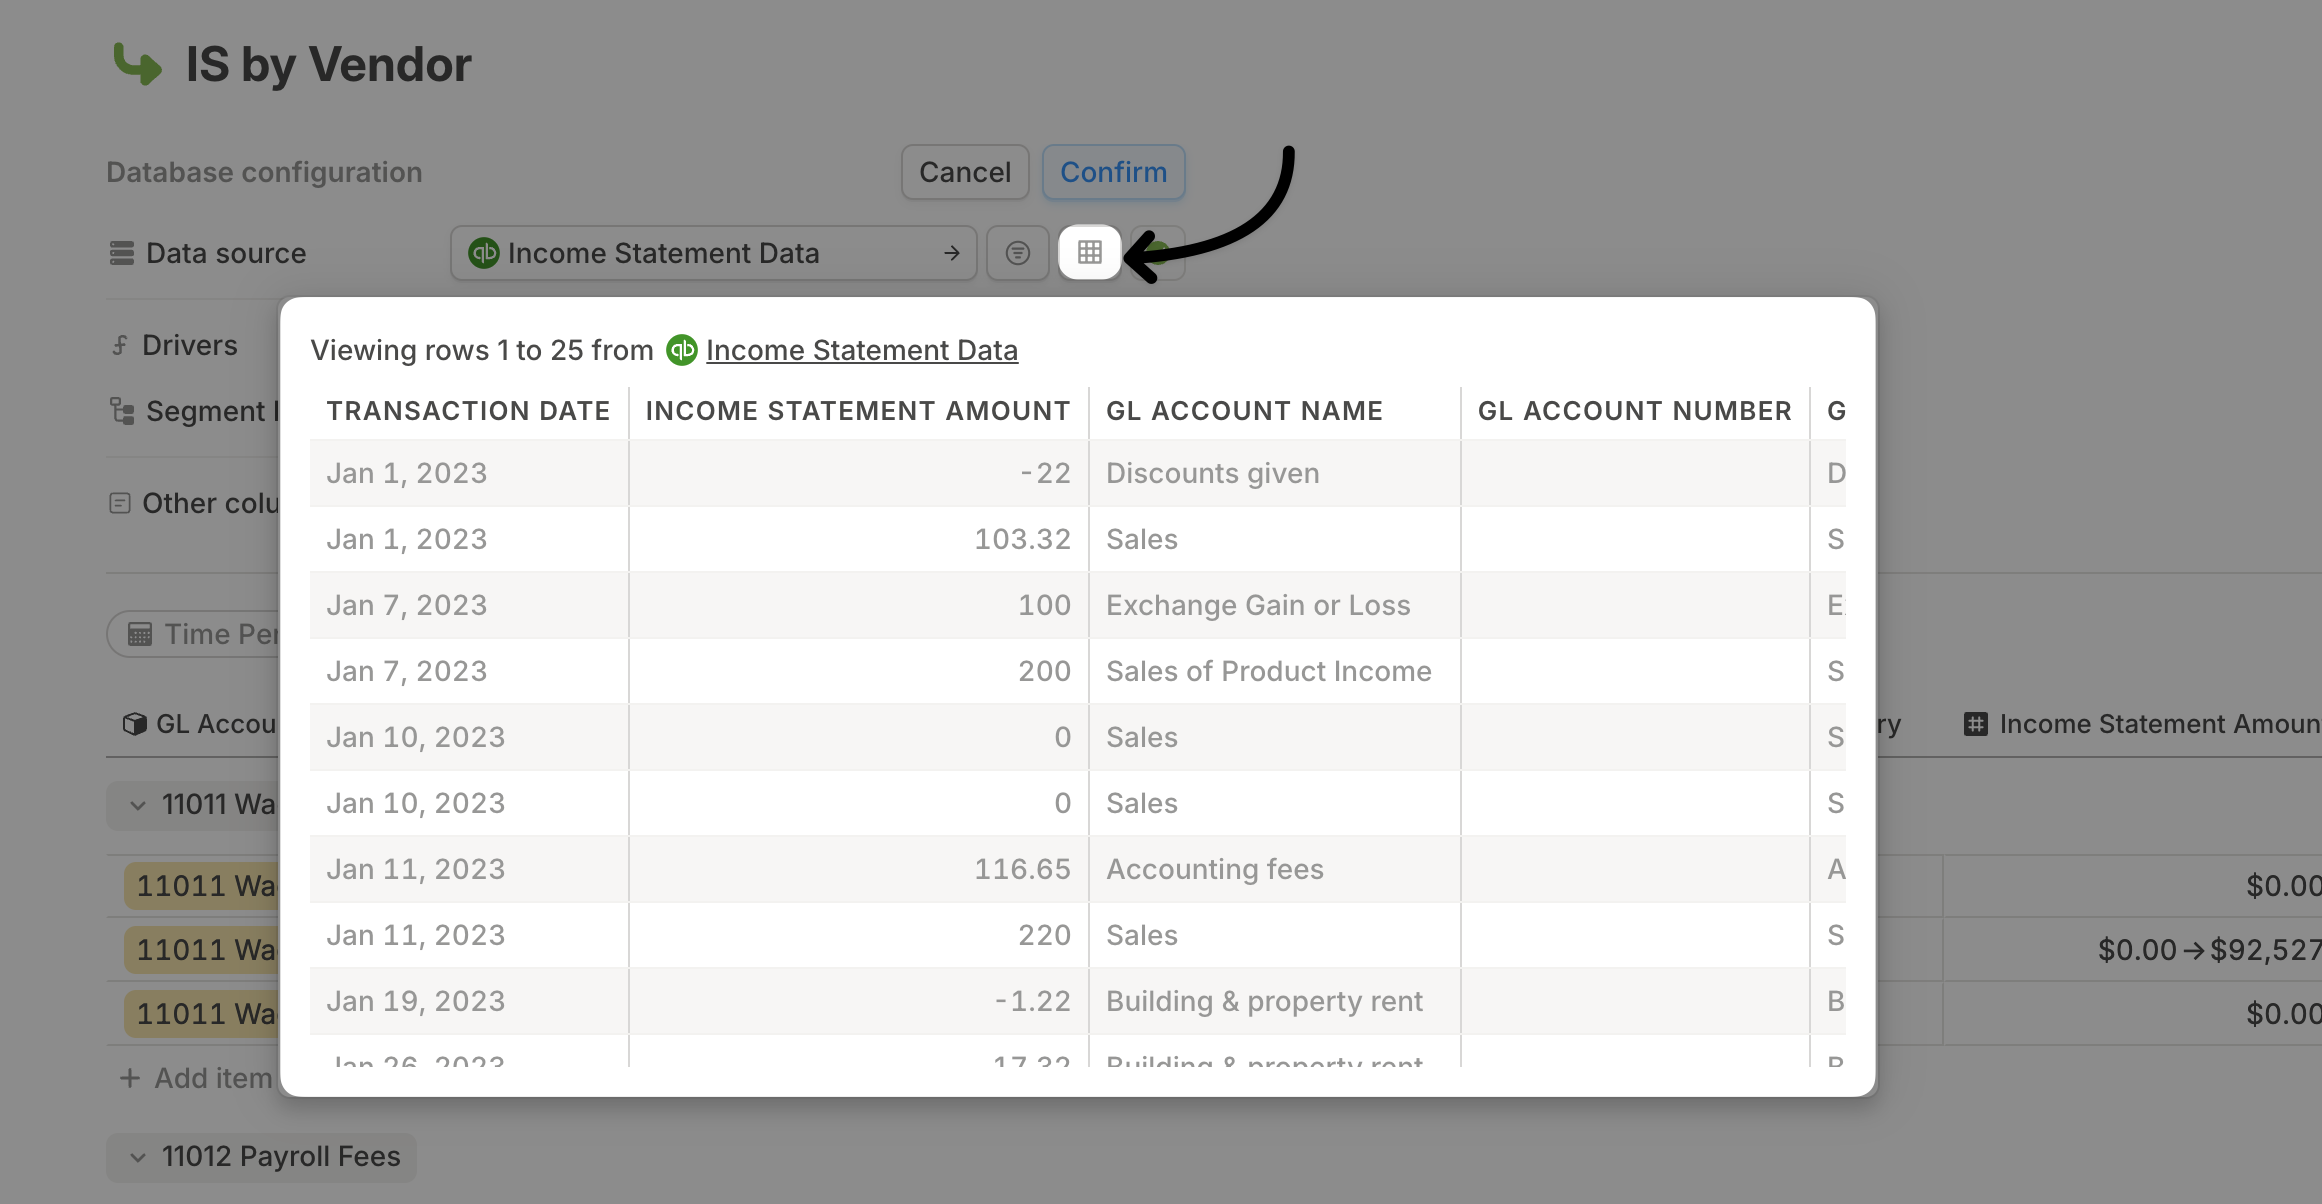 To limit the database to a subset of source data, apply a filter within the database configuration.
 ## Adding a column
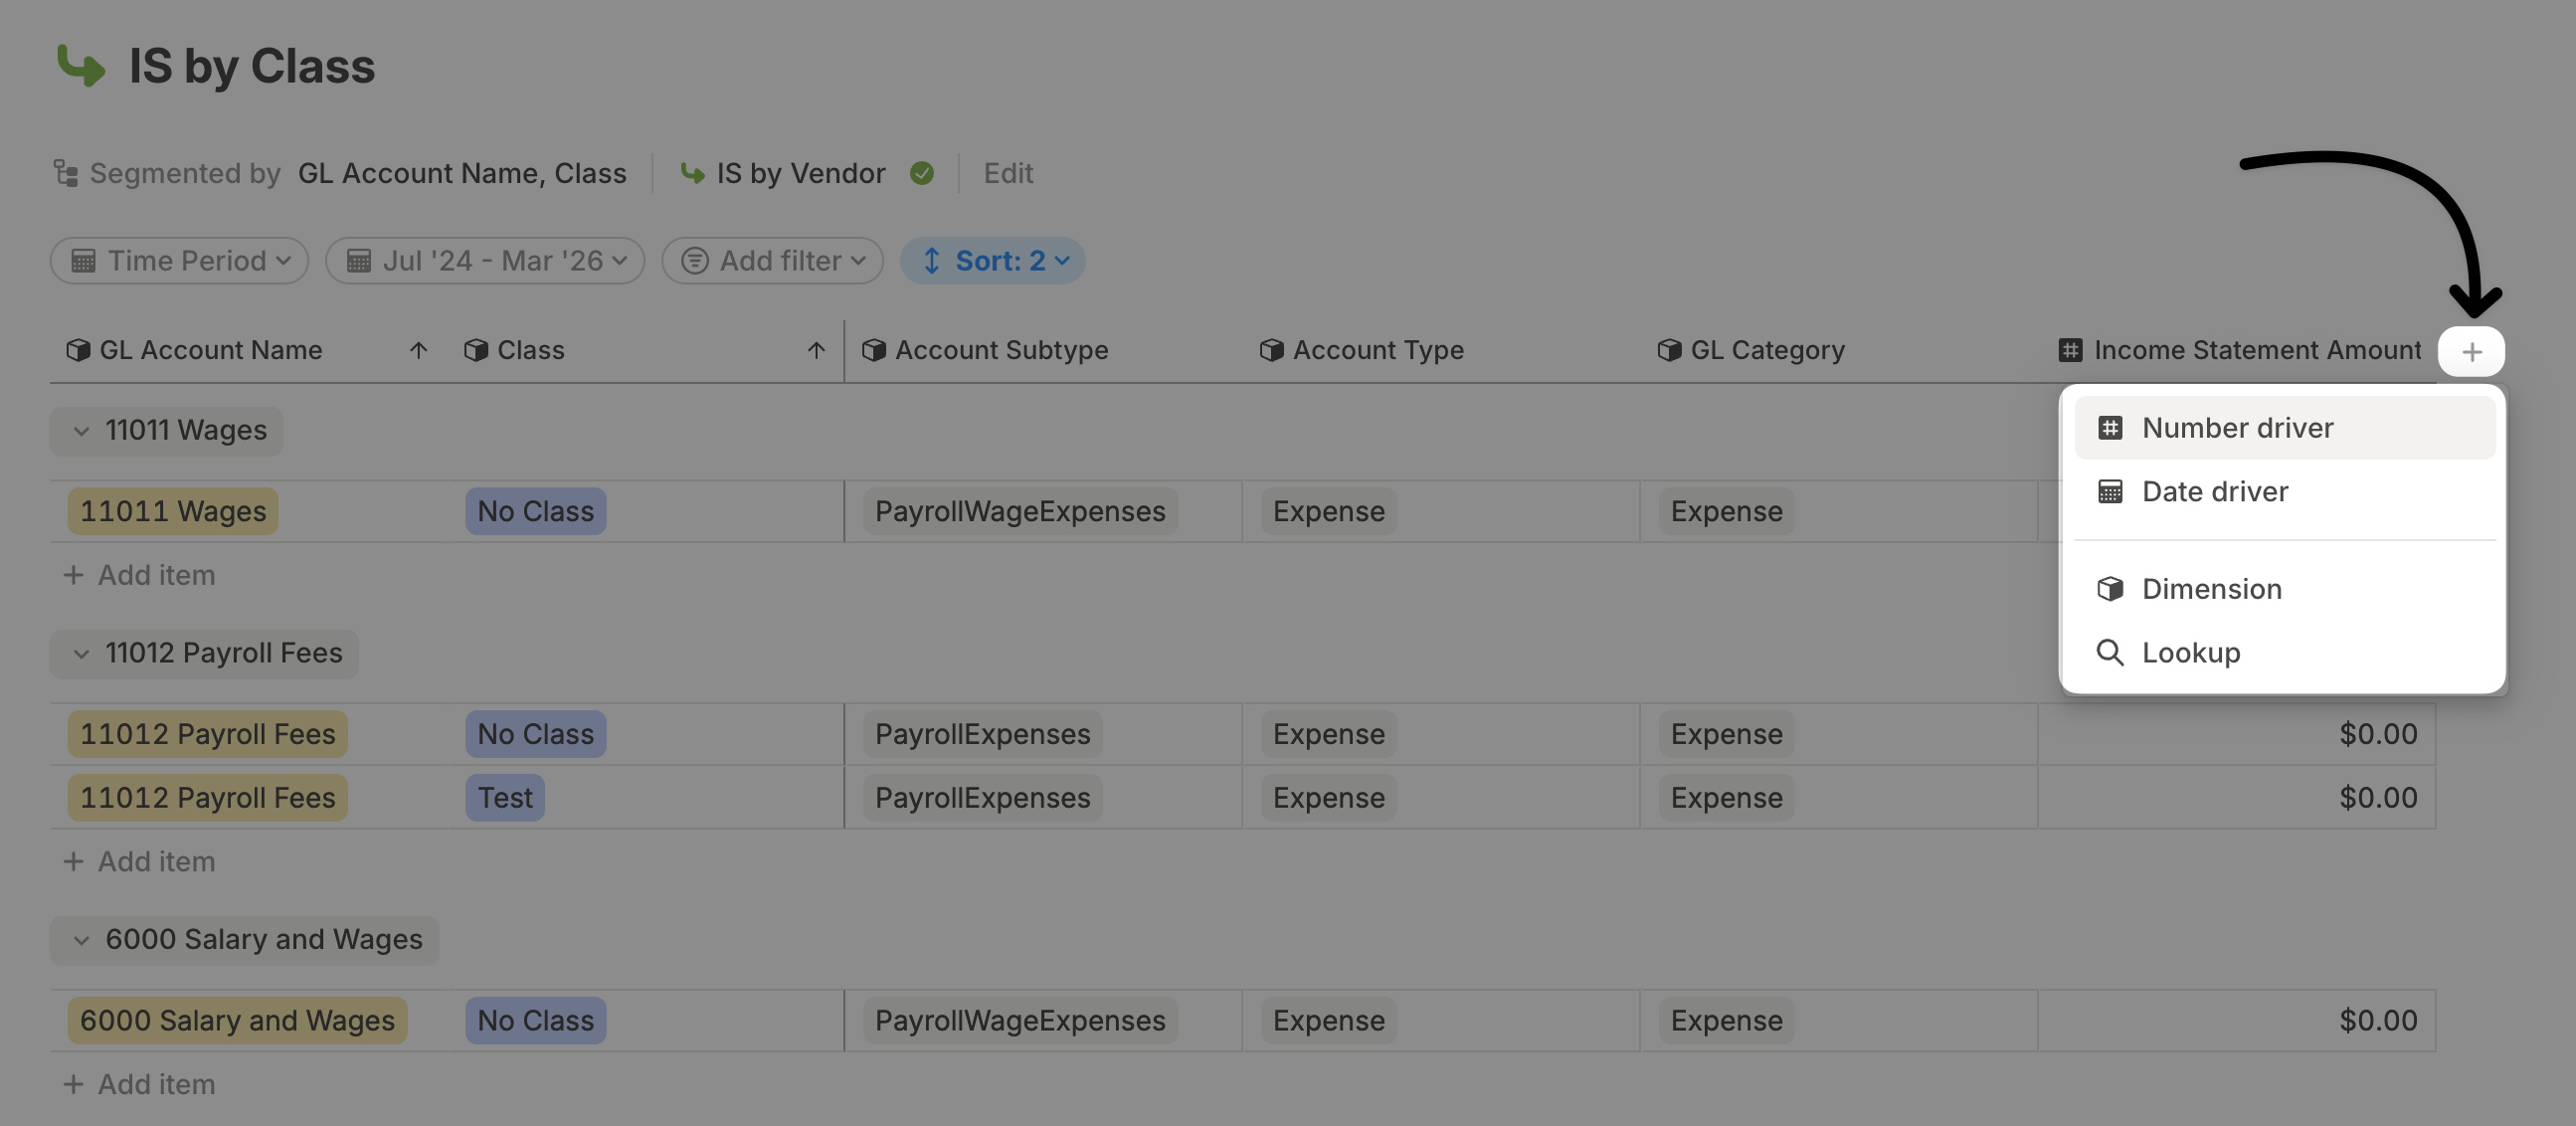
To create a new column, click the **+** button at the far right of the database. You can add:
* **Number driver:** Calculated numeric values. Drivers store time series data, so values can vary by month.
* **Date driver:** Date values that can also vary over time.
* **Dimension:** A predefined list of values that categorizes rows, such as Vendor, Location, or Department.
* **Lookup:** A column that populates a dimension based on data from another database, similar to `VLOOKUP()`.
For HRIS databases, follow the separate [HRIS database column flow](/concepts/databases/hris-databases#adding-columns-to-hris-databases).
## Adding a column
To create a new column, click the **+** button at the far right of the database. You can add:
* **Number driver:** Calculated numeric values. Drivers store time series data, so values can vary by month.
* **Date driver:** Date values that can also vary over time.
* **Dimension:** A predefined list of values that categorizes rows, such as Vendor, Location, or Department.
* **Lookup:** A column that populates a dimension based on data from another database, similar to `VLOOKUP()`.
For HRIS databases, follow the separate [HRIS database column flow](/concepts/databases/hris-databases#adding-columns-to-hris-databases).
 ## Show a column as time series
Drivers store time series data. In database tables, each driver column is usually displayed as a single value for readability, but you can expand one driver column to show its monthly values.
Click the driver column name in the database header.
Select **Show as time series**. The column expands on the far right after the other columns.
## Show a column as time series
Drivers store time series data. In database tables, each driver column is usually displayed as a single value for readability, but you can expand one driver column to show its monthly values.
Click the driver column name in the database header.
Select **Show as time series**. The column expands on the far right after the other columns.
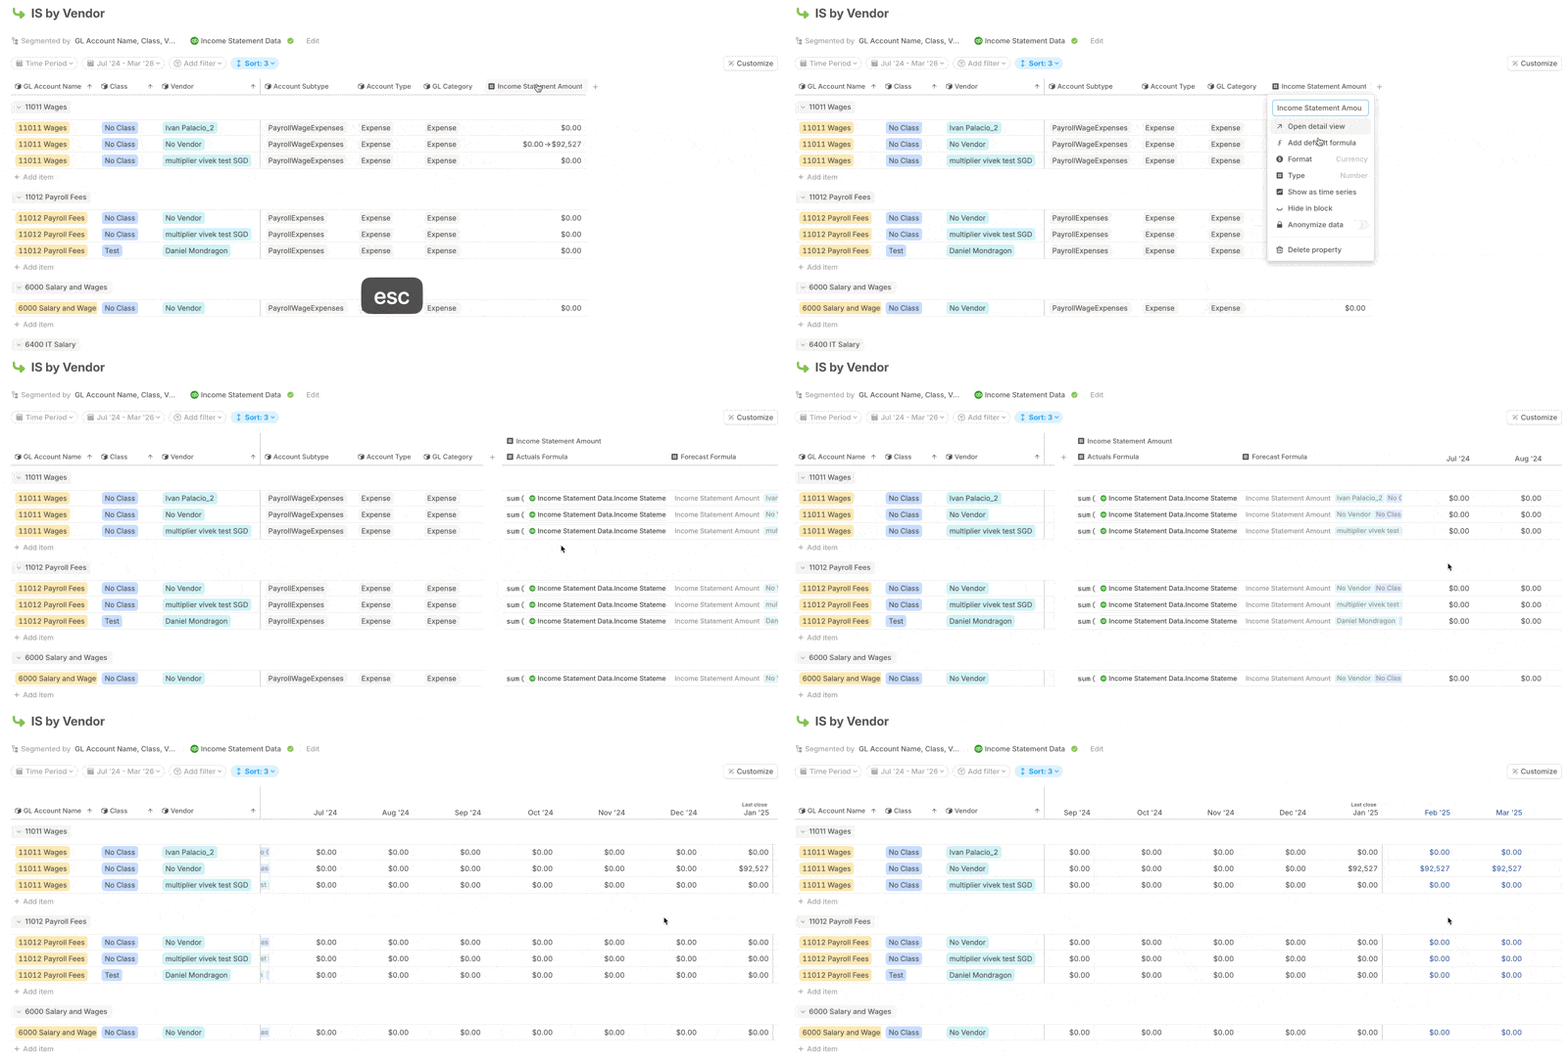 If you show a different driver column as a time series, it replaces the currently expanded one.
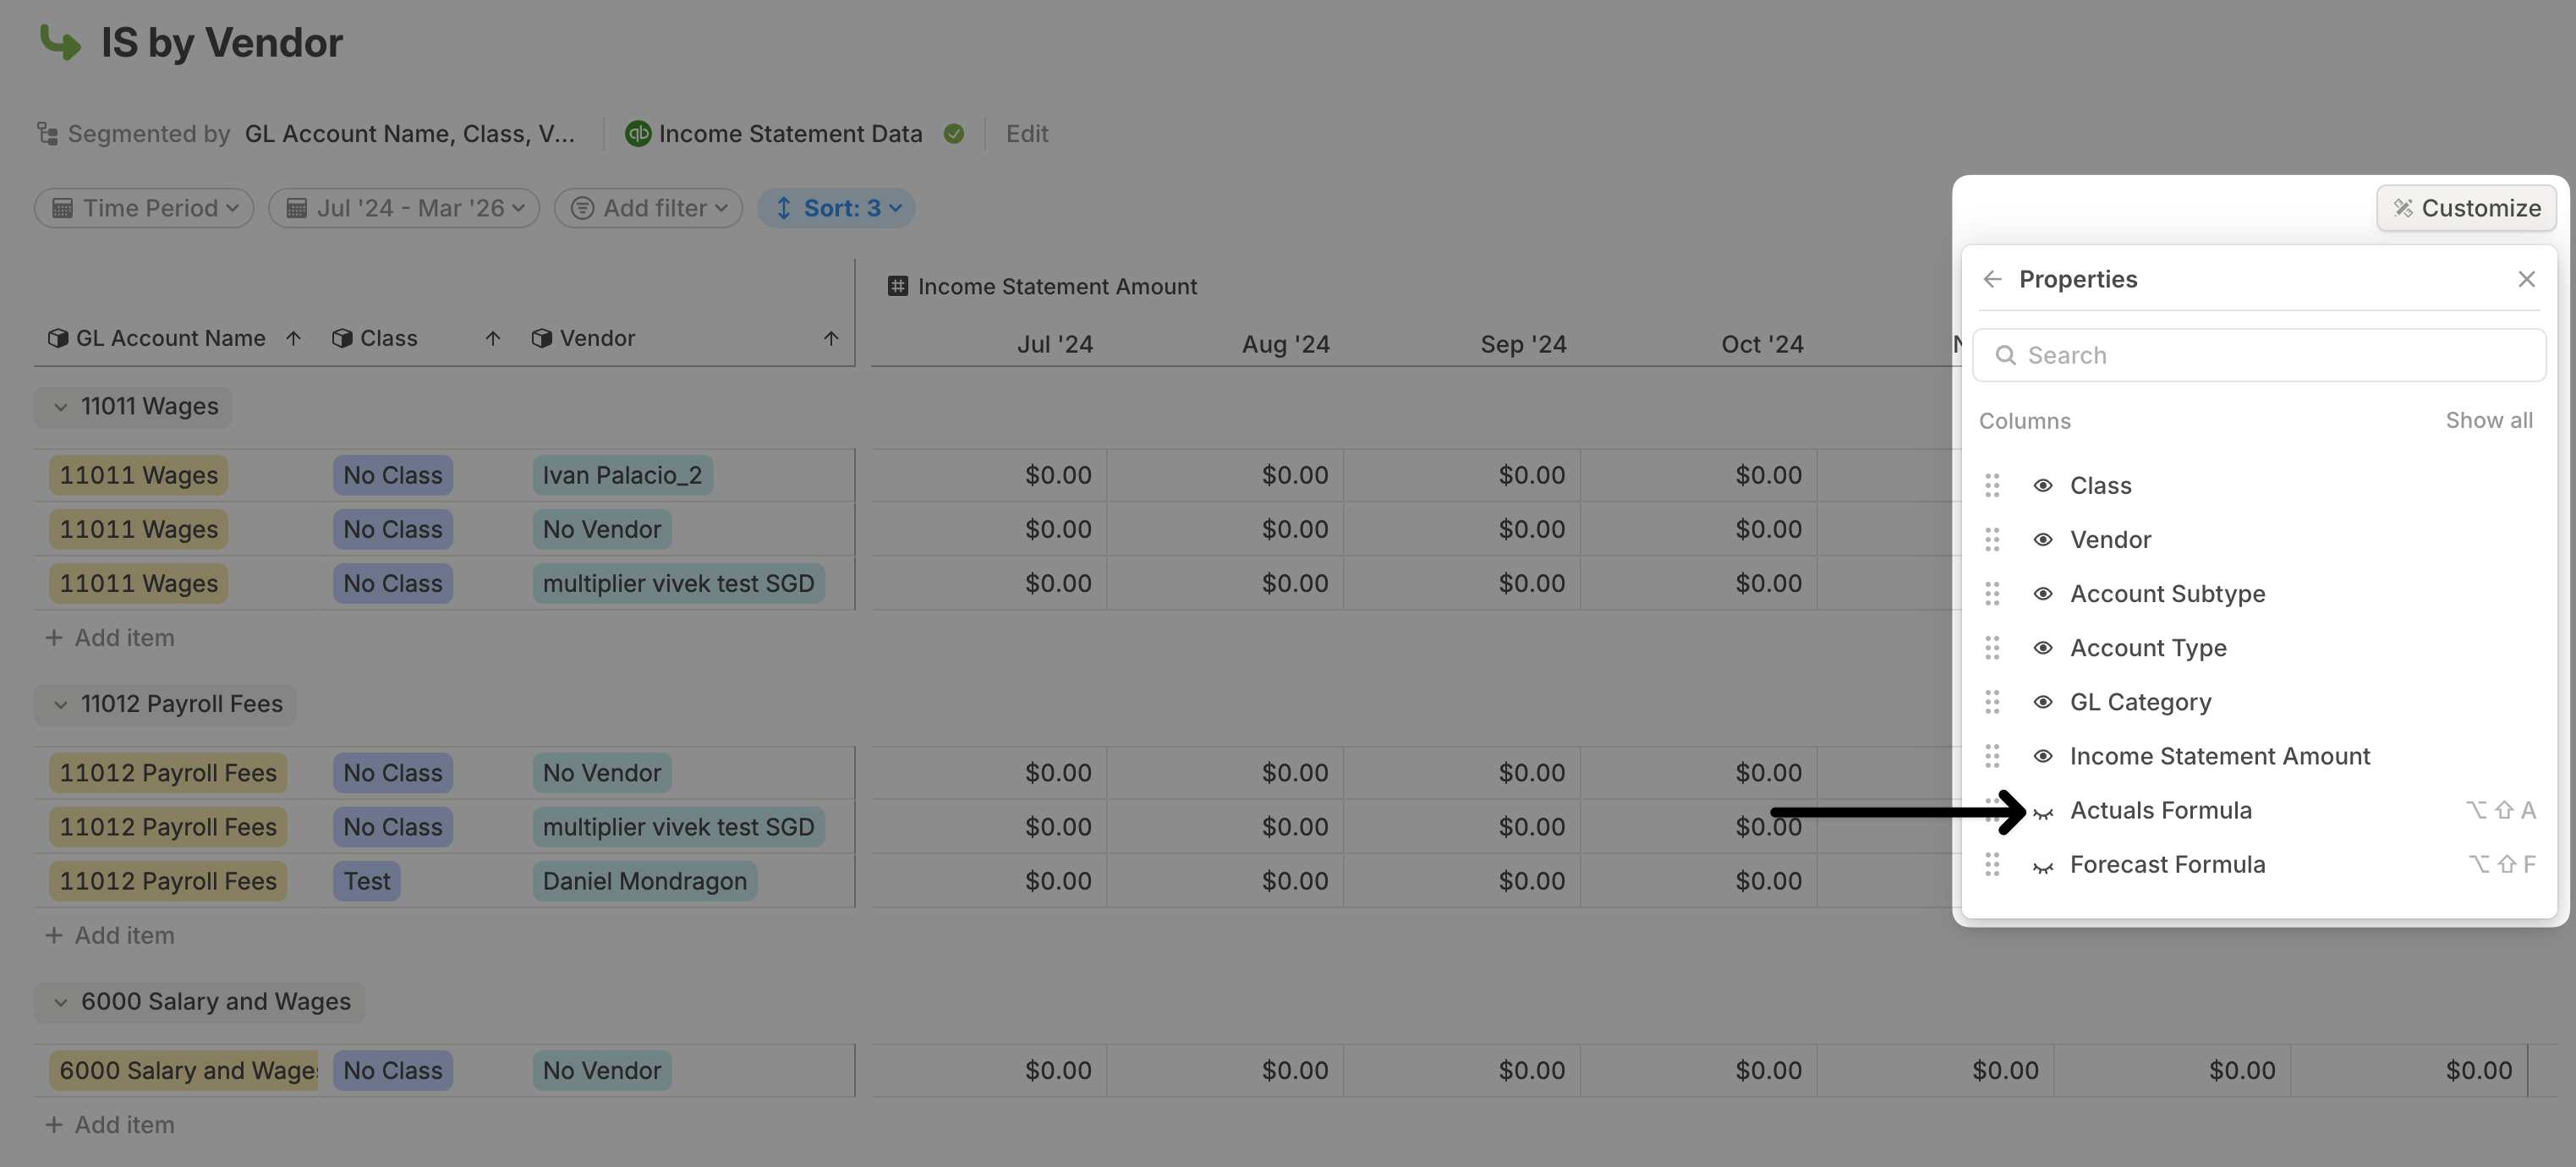
By default, each row shows forecast formula, actuals formula, and time series data for the selected date range. You can hide formula columns from column menus, from **Customize** > **Properties**, or with the shortcuts listed in [Keyboard shortcuts](/get-started/keyboard-shortcuts).
If you show a different driver column as a time series, it replaces the currently expanded one.
By default, each row shows forecast formula, actuals formula, and time series data for the selected date range. You can hide formula columns from column menus, from **Customize** > **Properties**, or with the shortcuts listed in [Keyboard shortcuts](/get-started/keyboard-shortcuts).
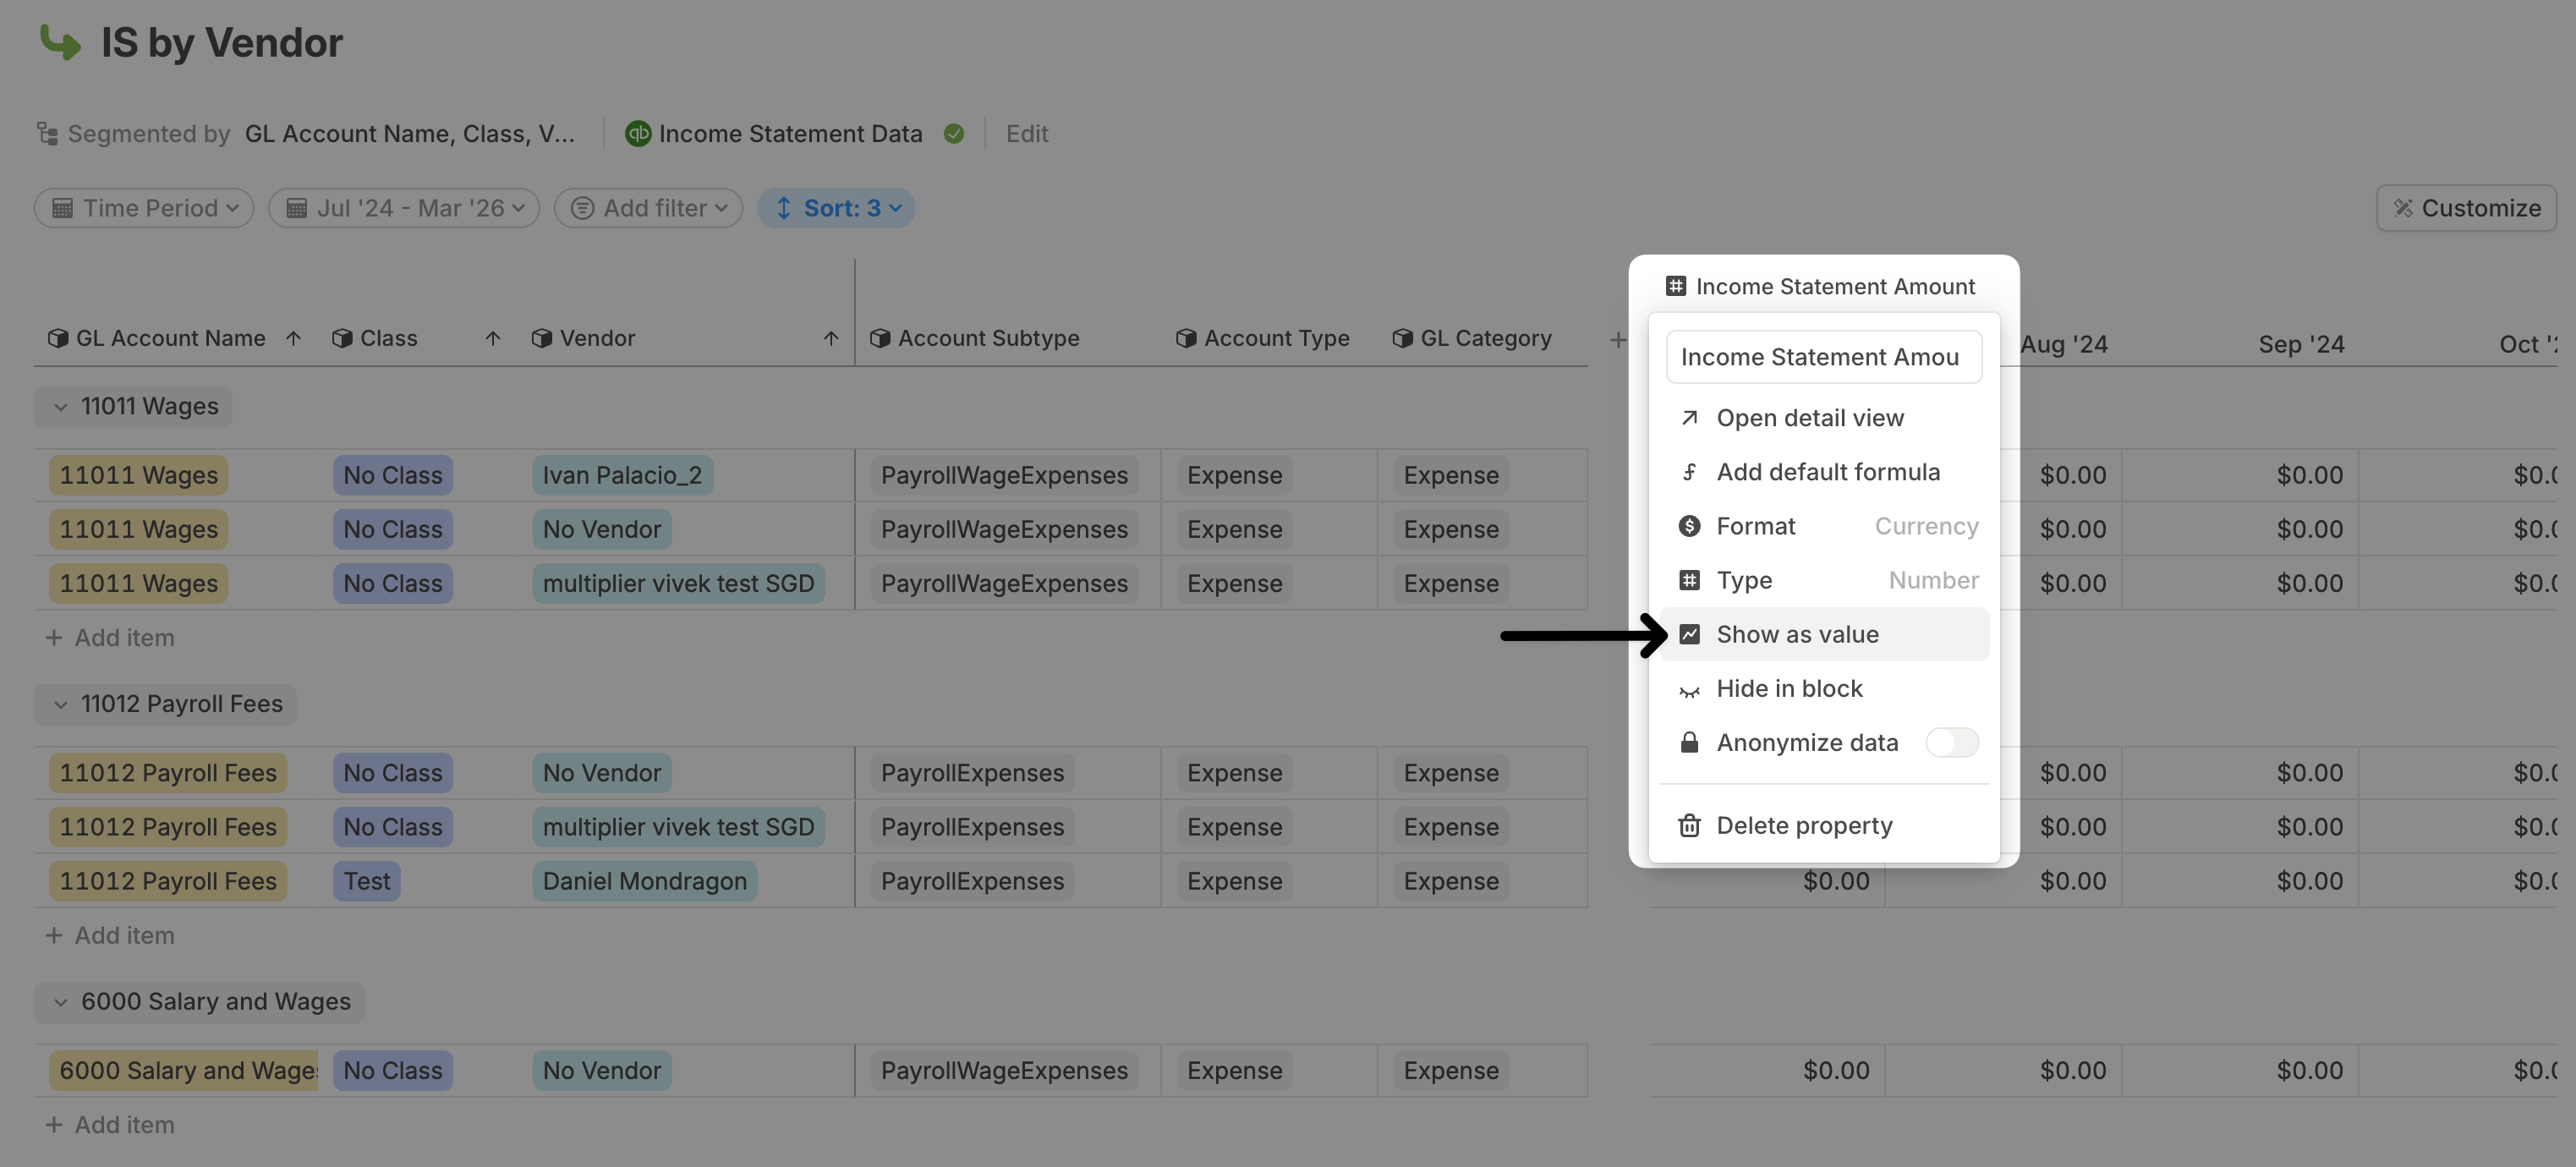
 To return the driver column to a single value, click the column name again and select **Show as value**.
 ## Show all columns as time series
Instead of expanding only one driver column, you can display all driver columns as time series.
Click **Customize** in the top-right corner.
Select **Display as**, then choose **Time series**.
## Show all columns as time series
Instead of expanding only one driver column, you can display all driver columns as time series.
Click **Customize** in the top-right corner.
Select **Display as**, then choose **Time series**.
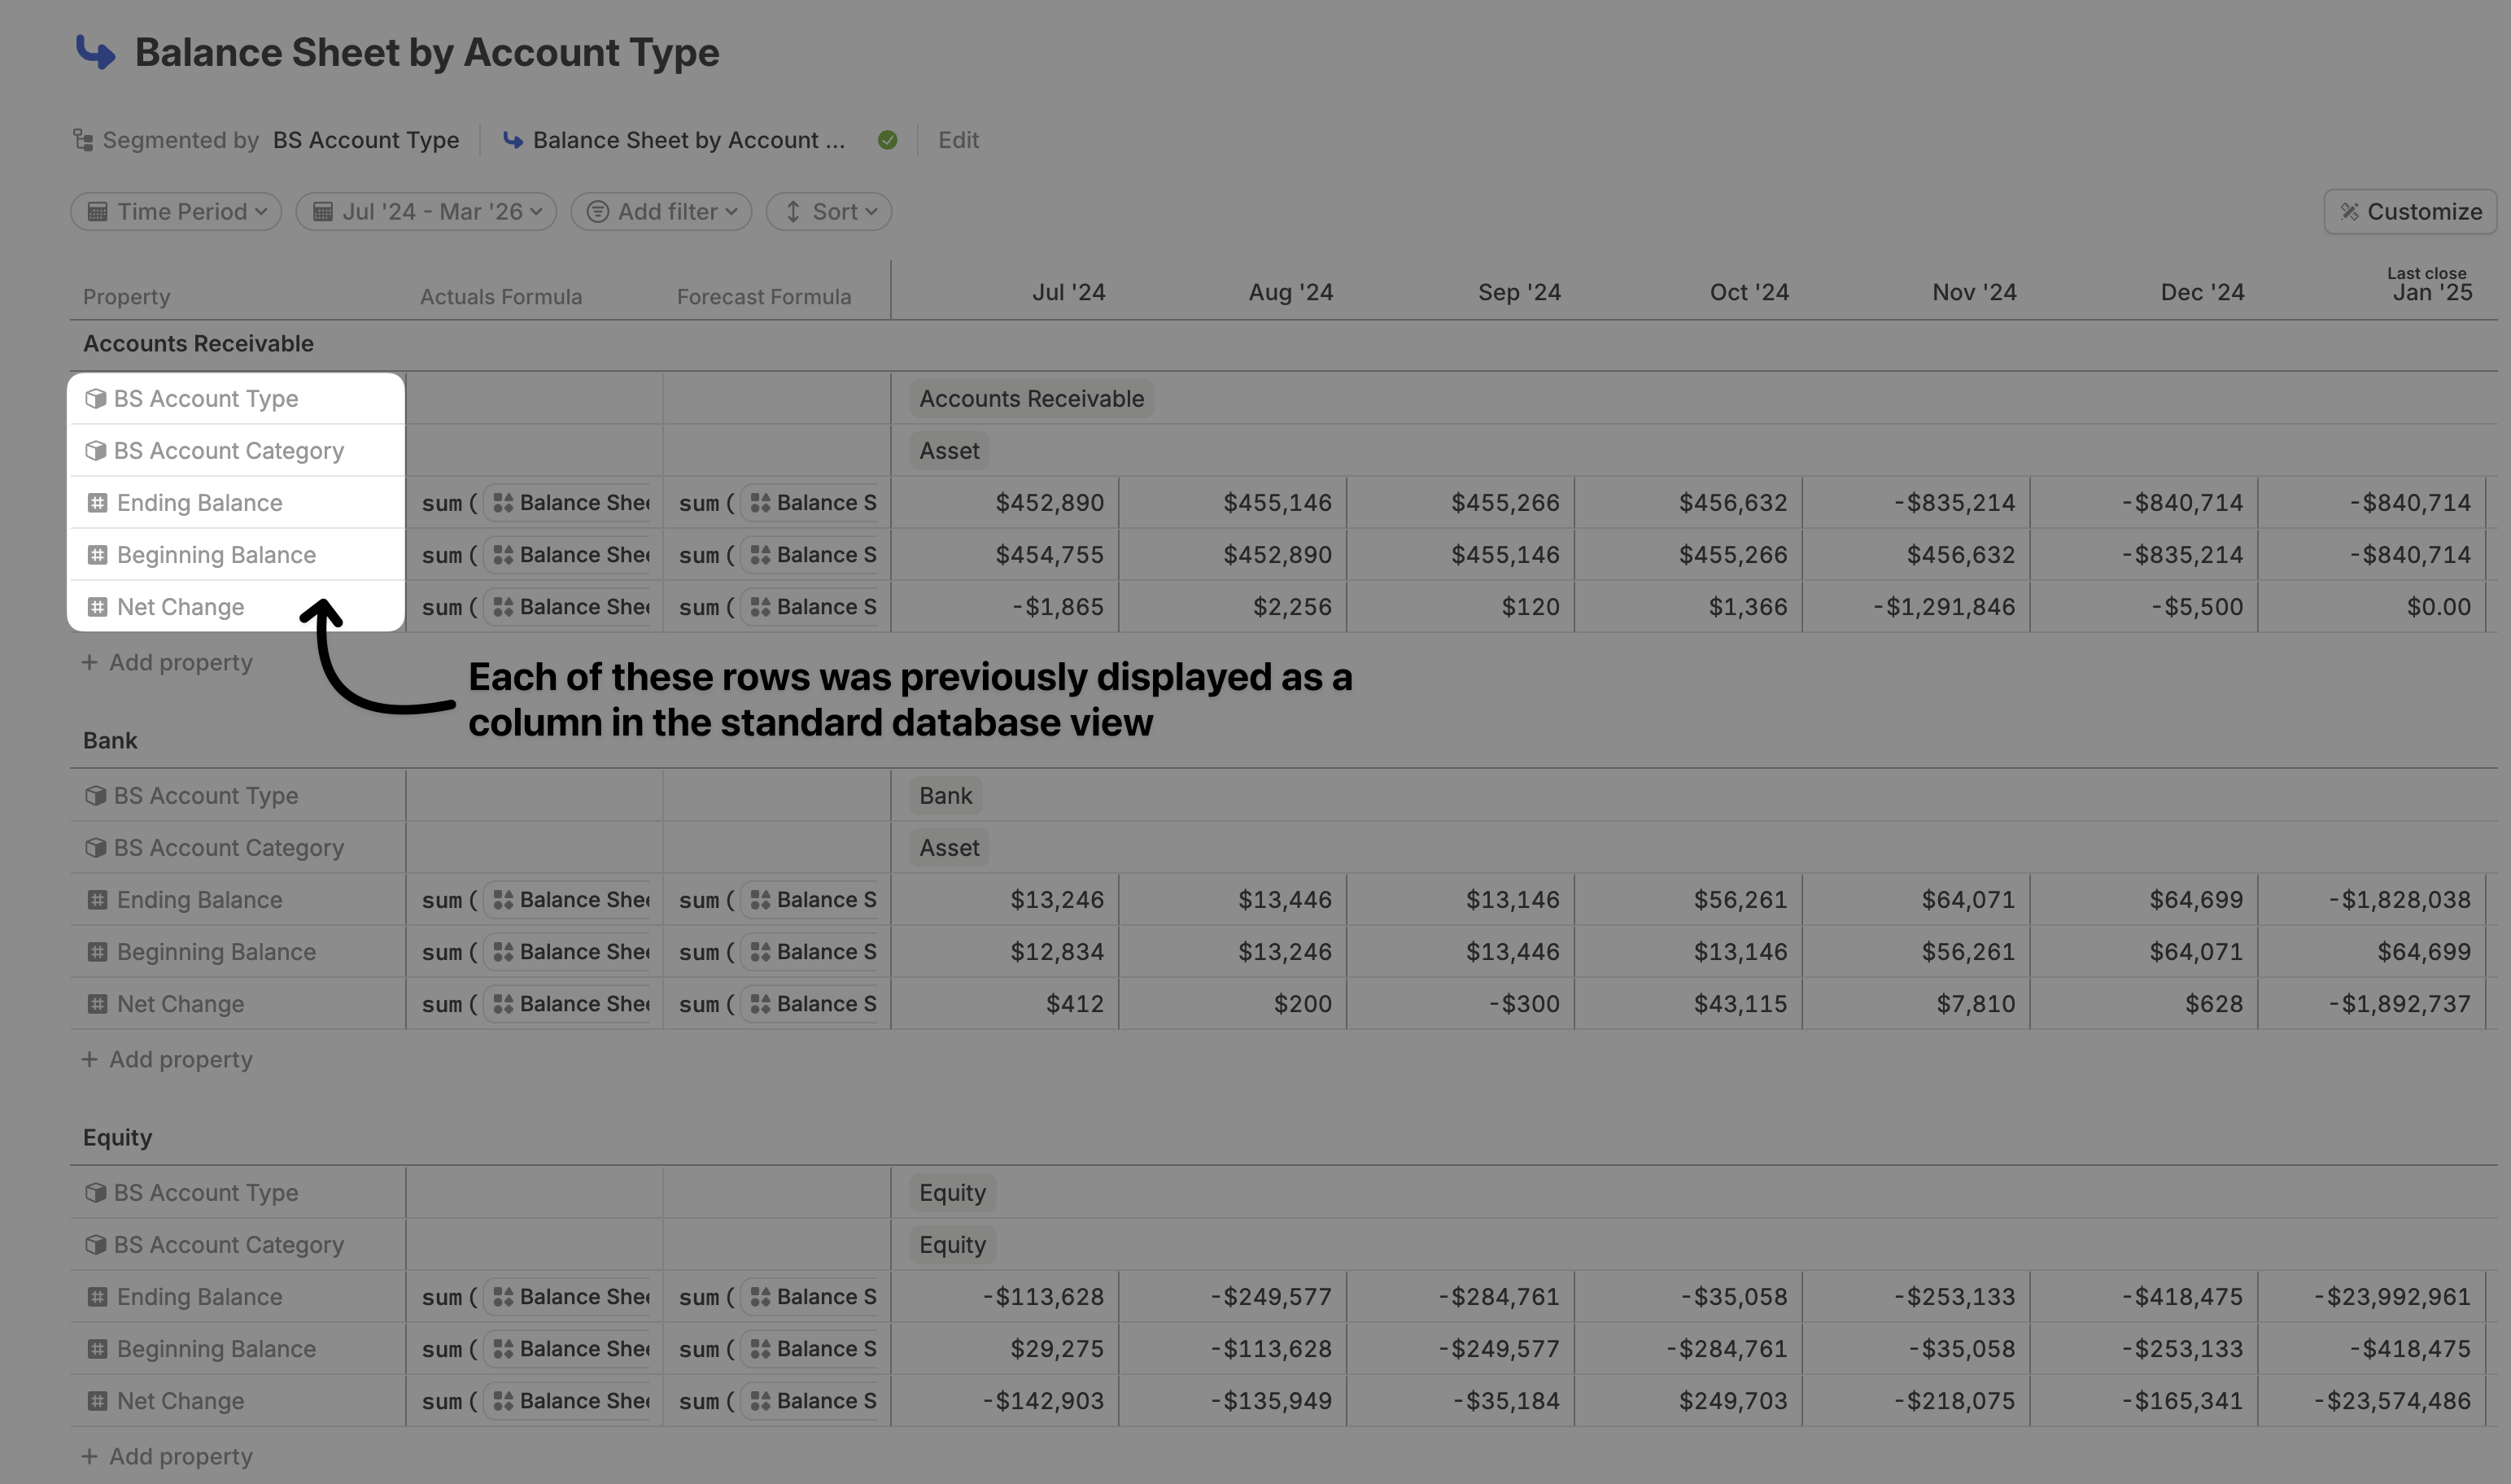
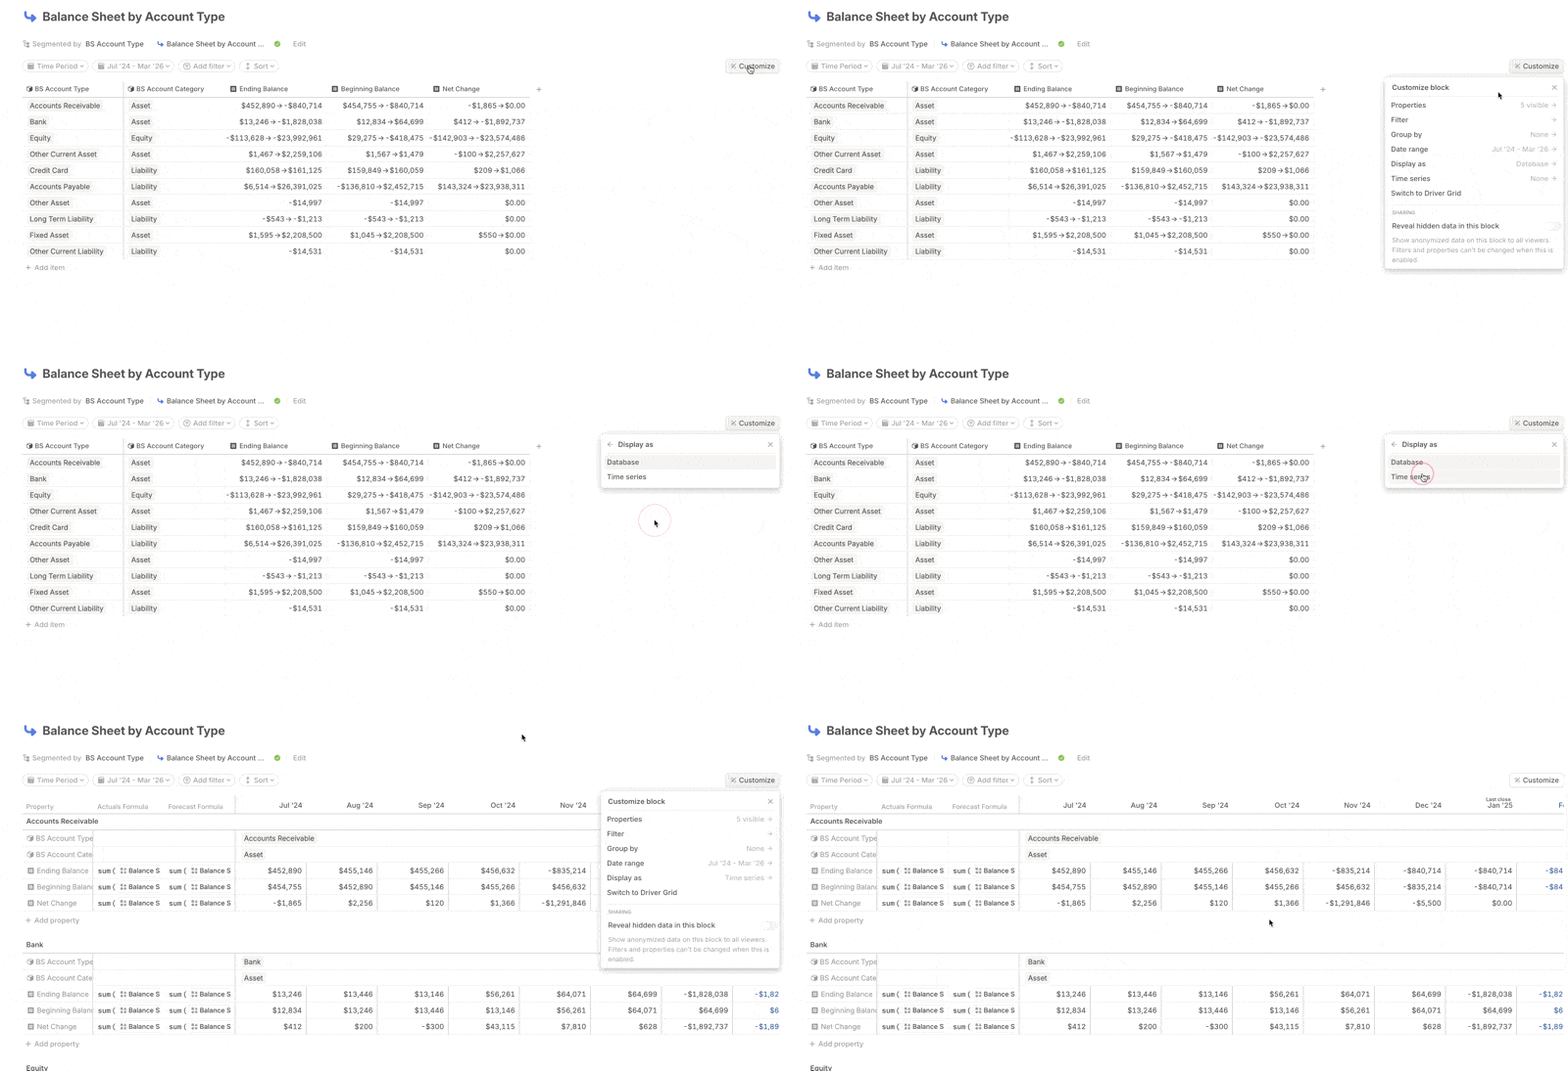 When you switch to this view, each former row becomes a section, and dimensions and drivers that were shown as columns become rows.
 ## Show and hide columns
For a compact view, hide columns that are not always relevant and show them only when needed.
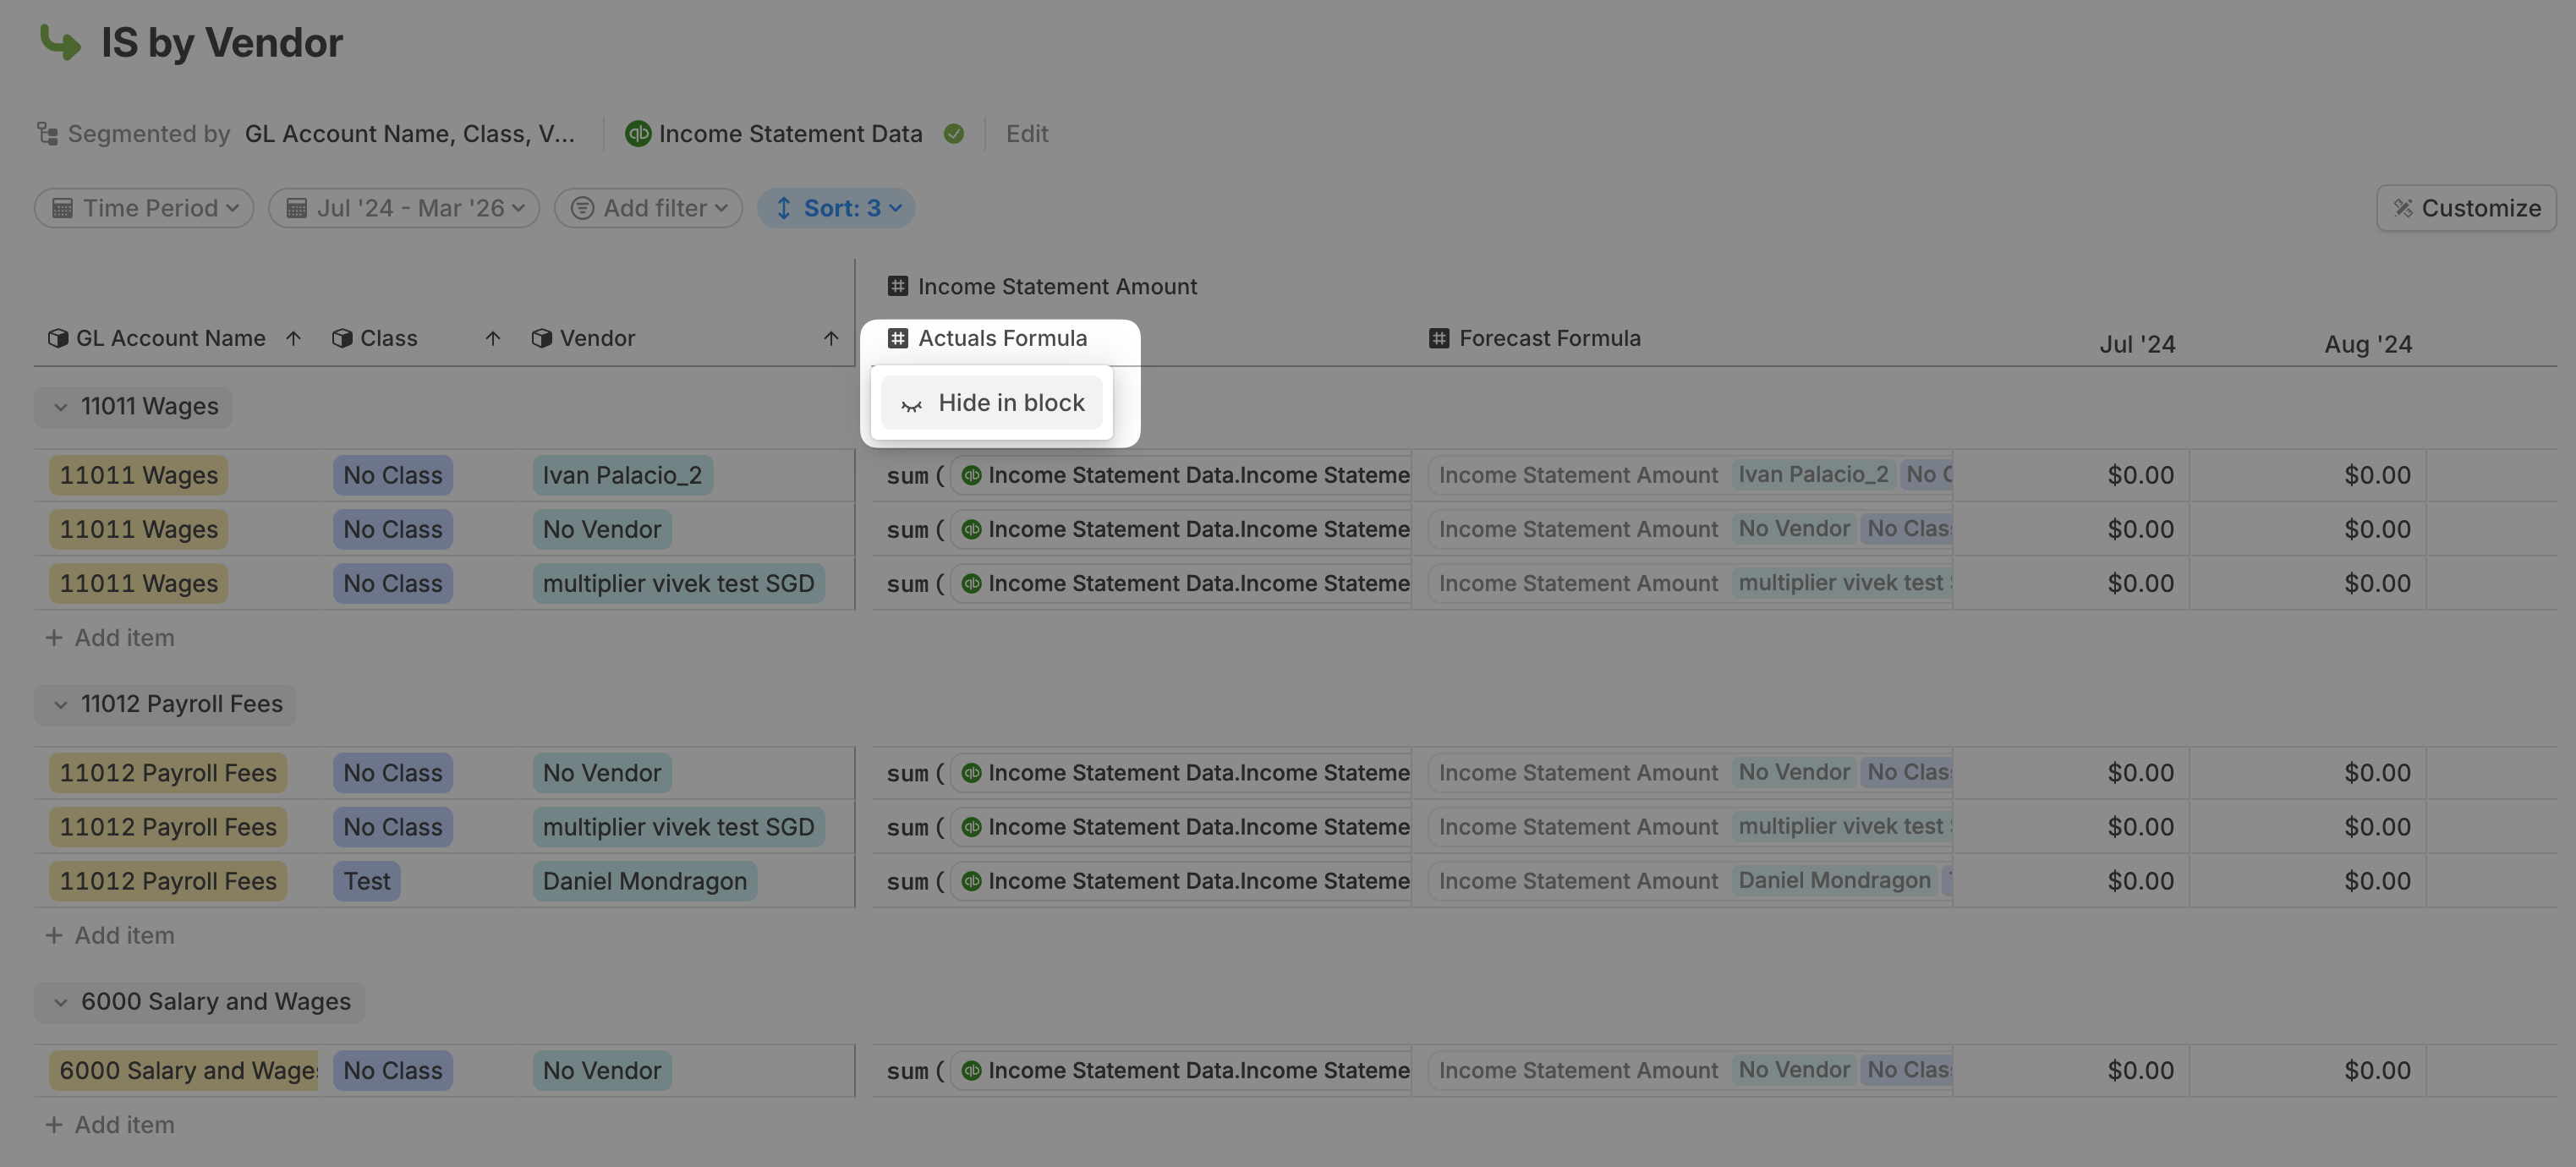
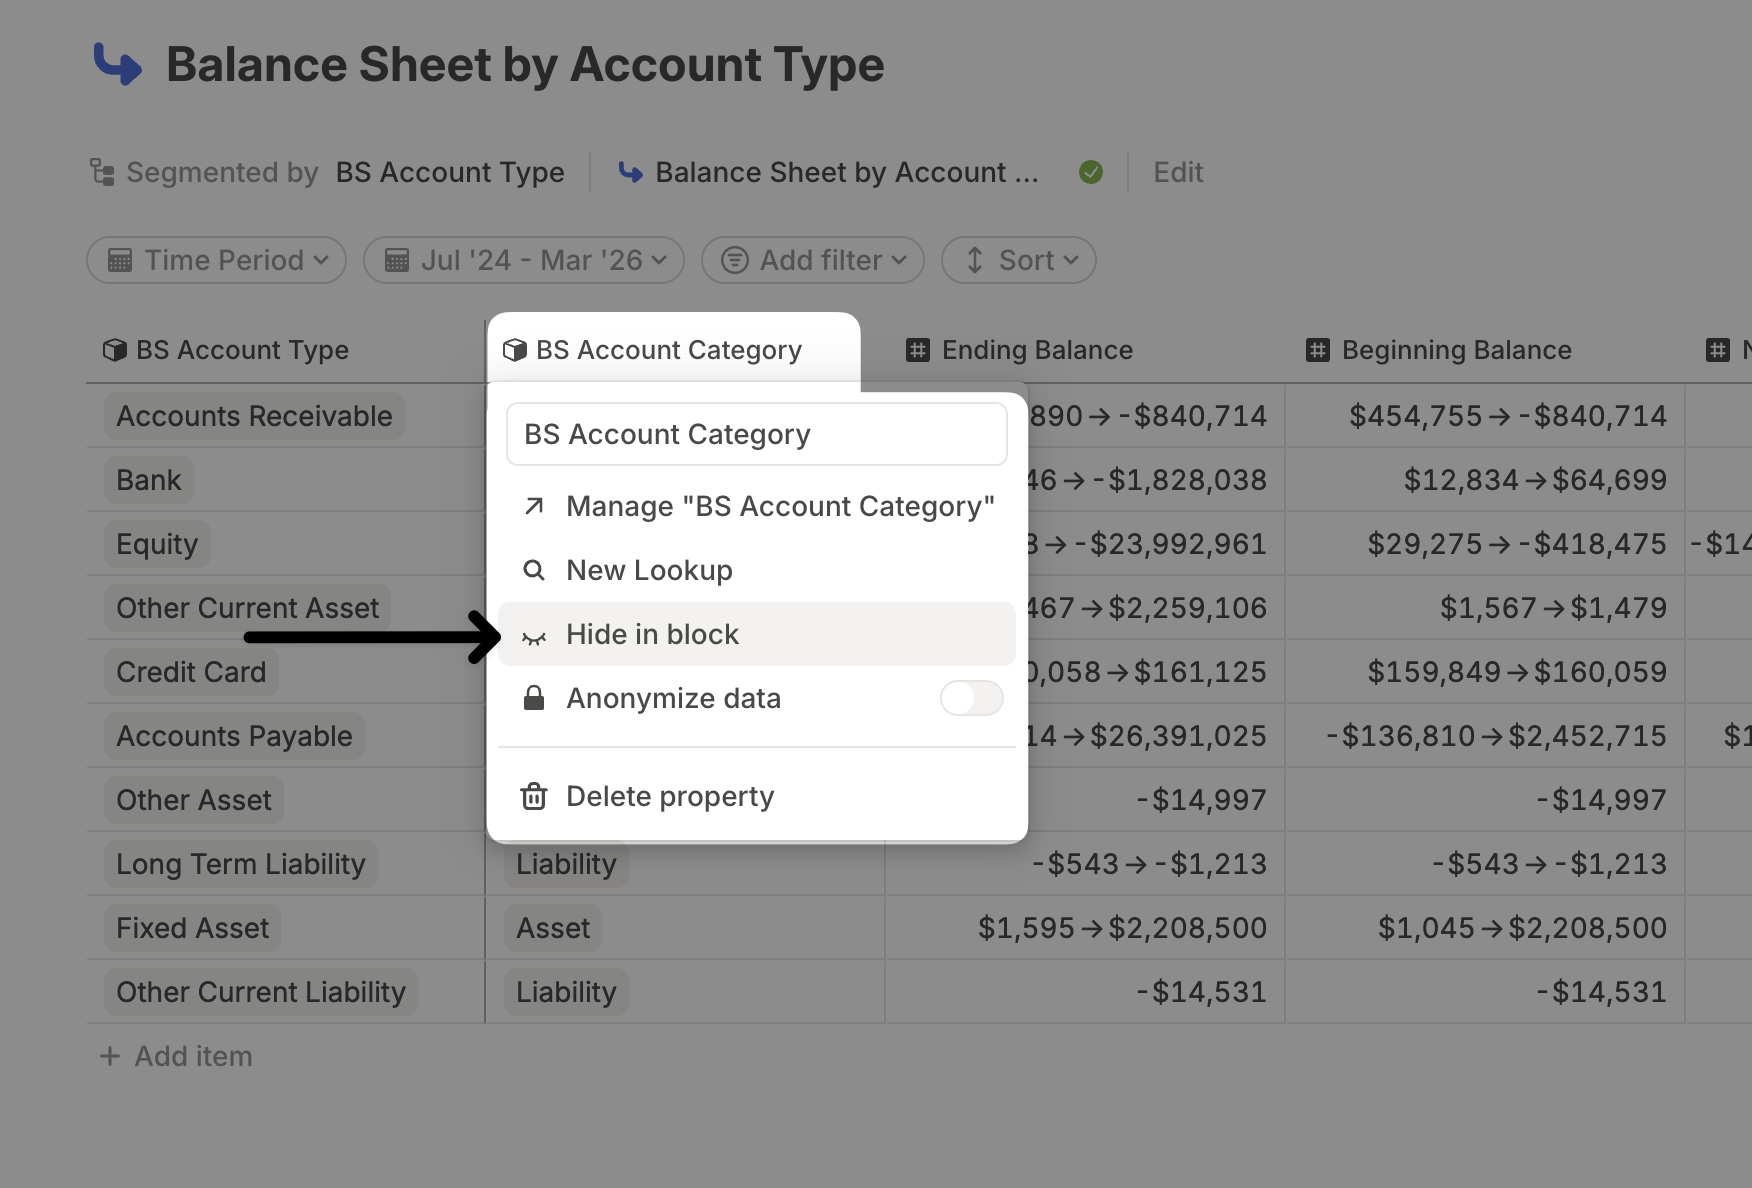
Click the column name in the database header and select **Hide in block**.
Or click **Customize**, open **Properties**, and toggle columns with the eye icon.
## Show and hide columns
For a compact view, hide columns that are not always relevant and show them only when needed.
Click the column name in the database header and select **Hide in block**.
Or click **Customize**, open **Properties**, and toggle columns with the eye icon.
 ## Adding a row
If you need to manually add a row to a database, click **+ Add item**. After adding the row, set values for the dimensions used in **Segment by**.
## Adding a row
If you need to manually add a row to a database, click **+ Add item**. After adding the row, set values for the dimensions used in **Segment by**.
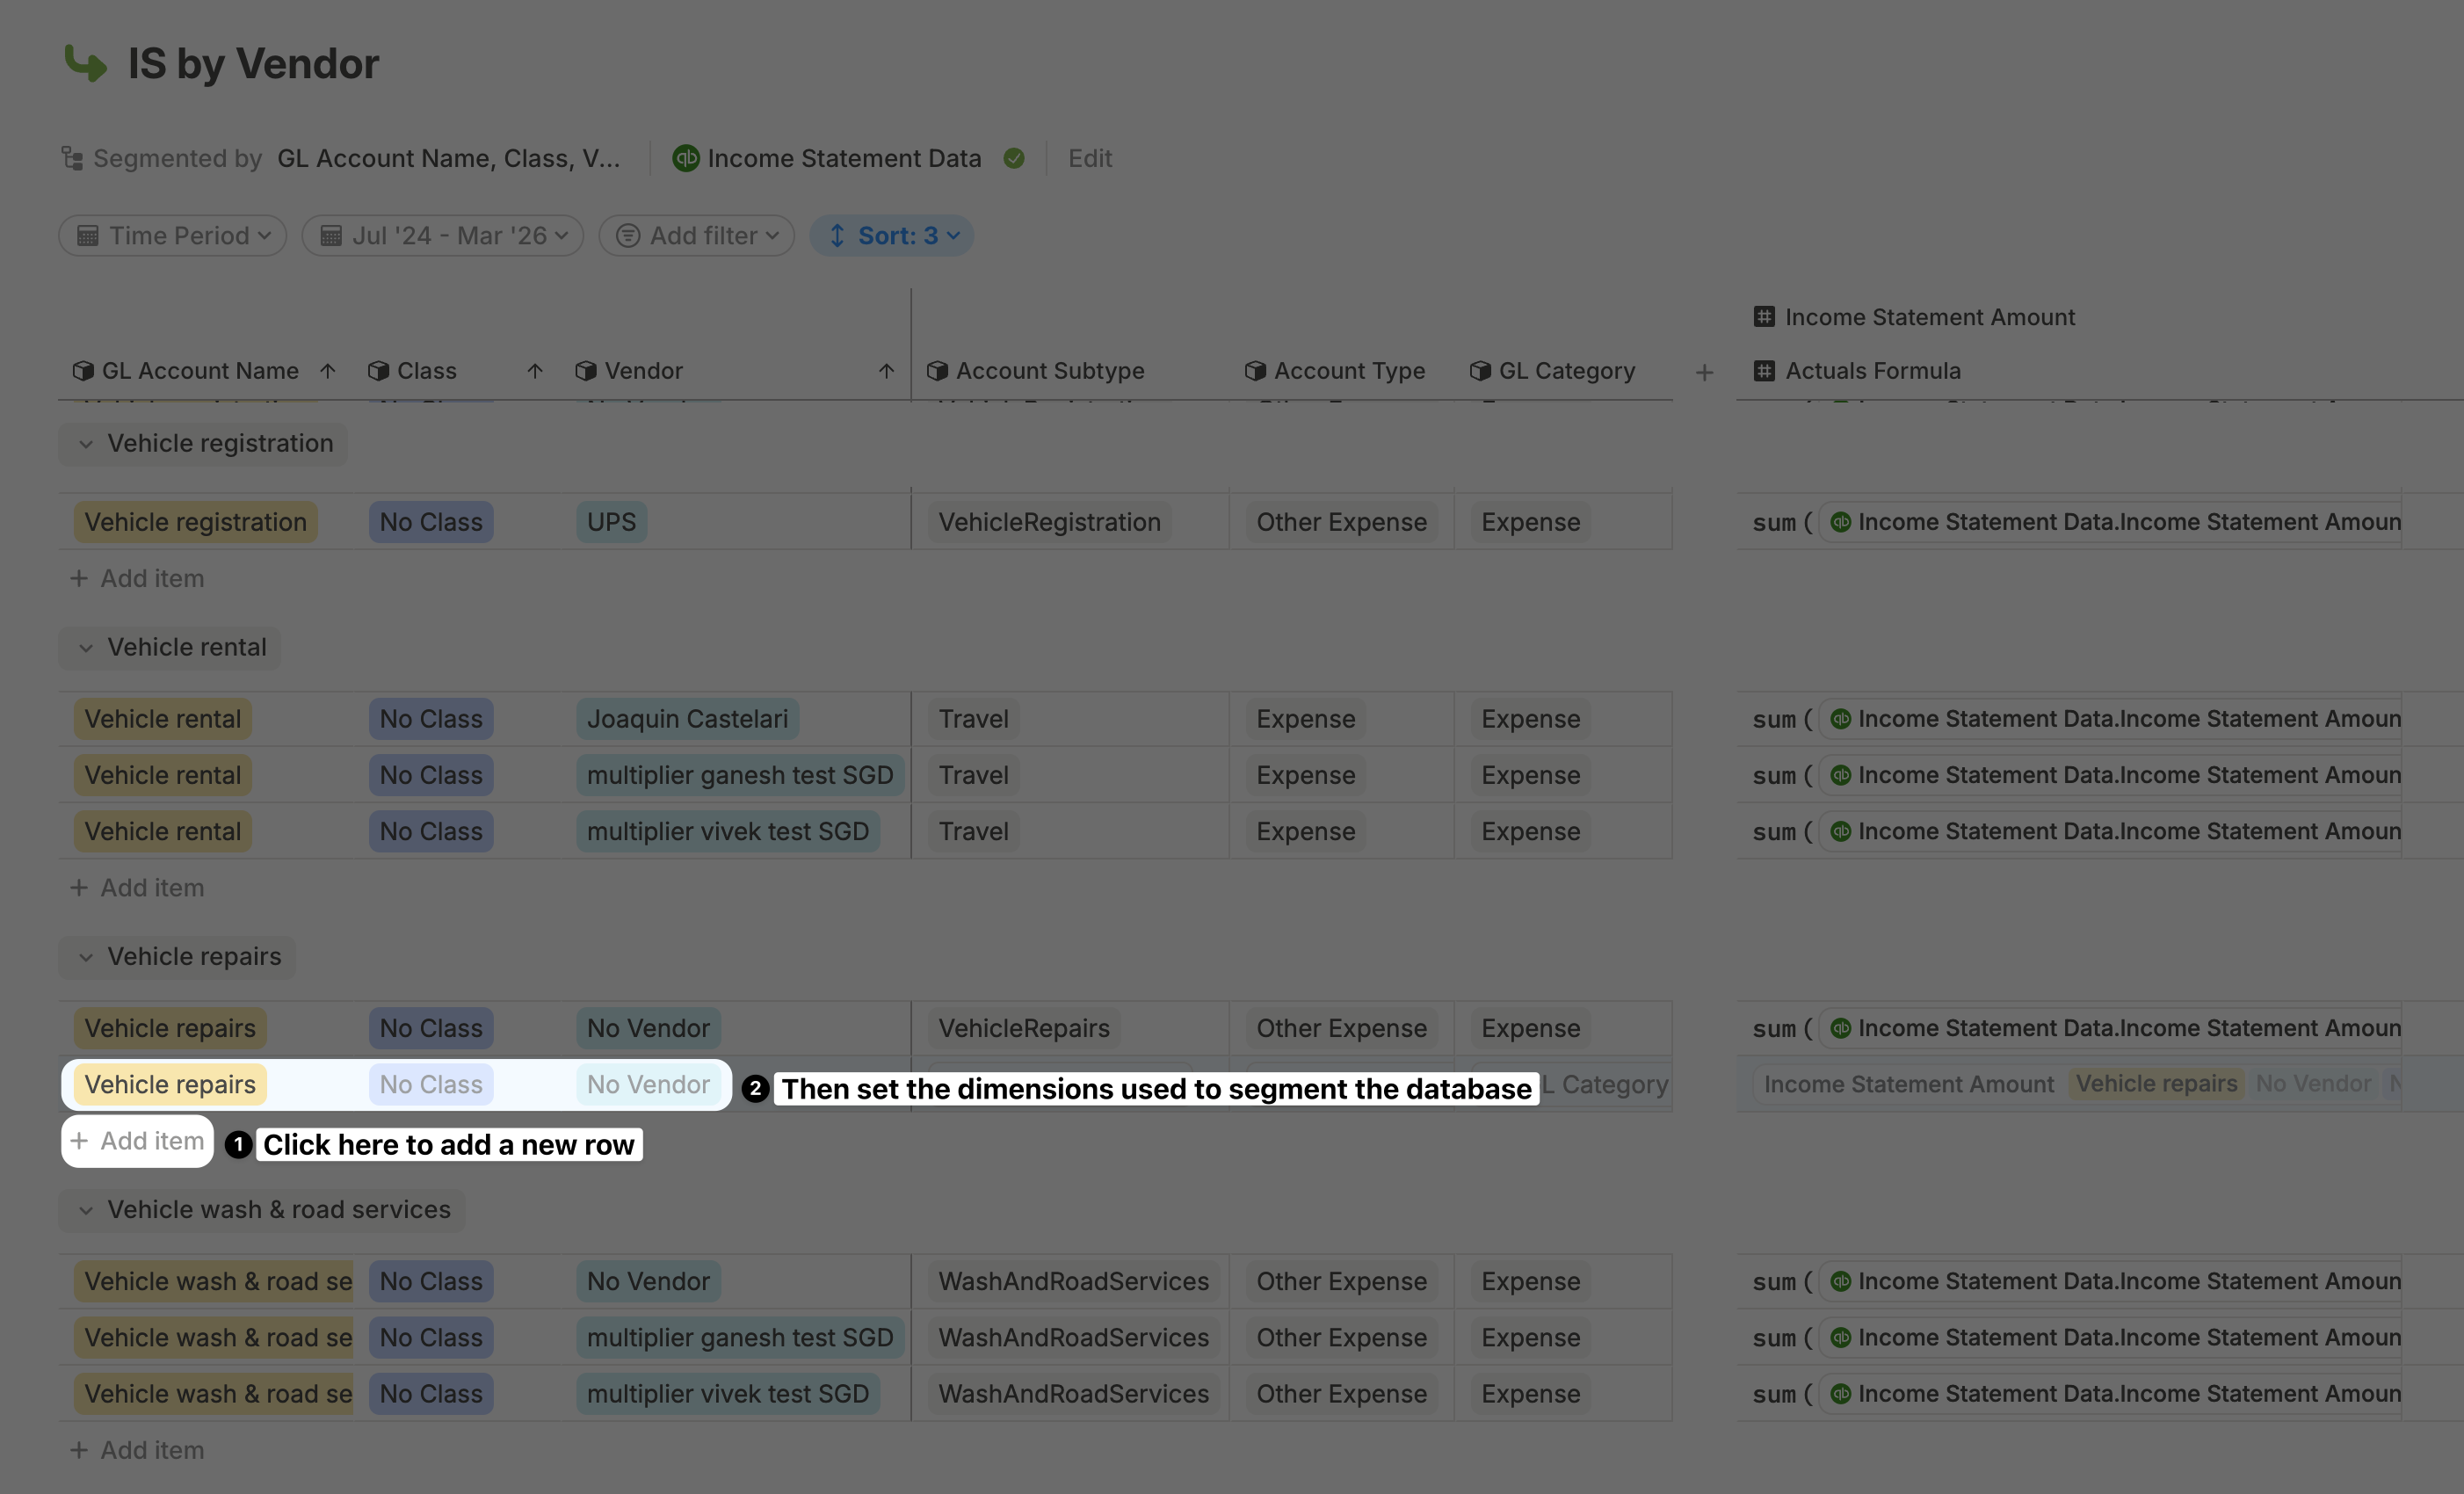 Segmentation determines the granularity of your database. Each row should have a unique combination of dimension values. If a row does not have a unique combination, Runway shows a warning because that row is linked to other rows with the same segmentation.
For HRIS databases, follow the [HRIS database row flow](/concepts/databases/hris-databases).
## Deleting a column
The deletion flow depends on how the column was added.
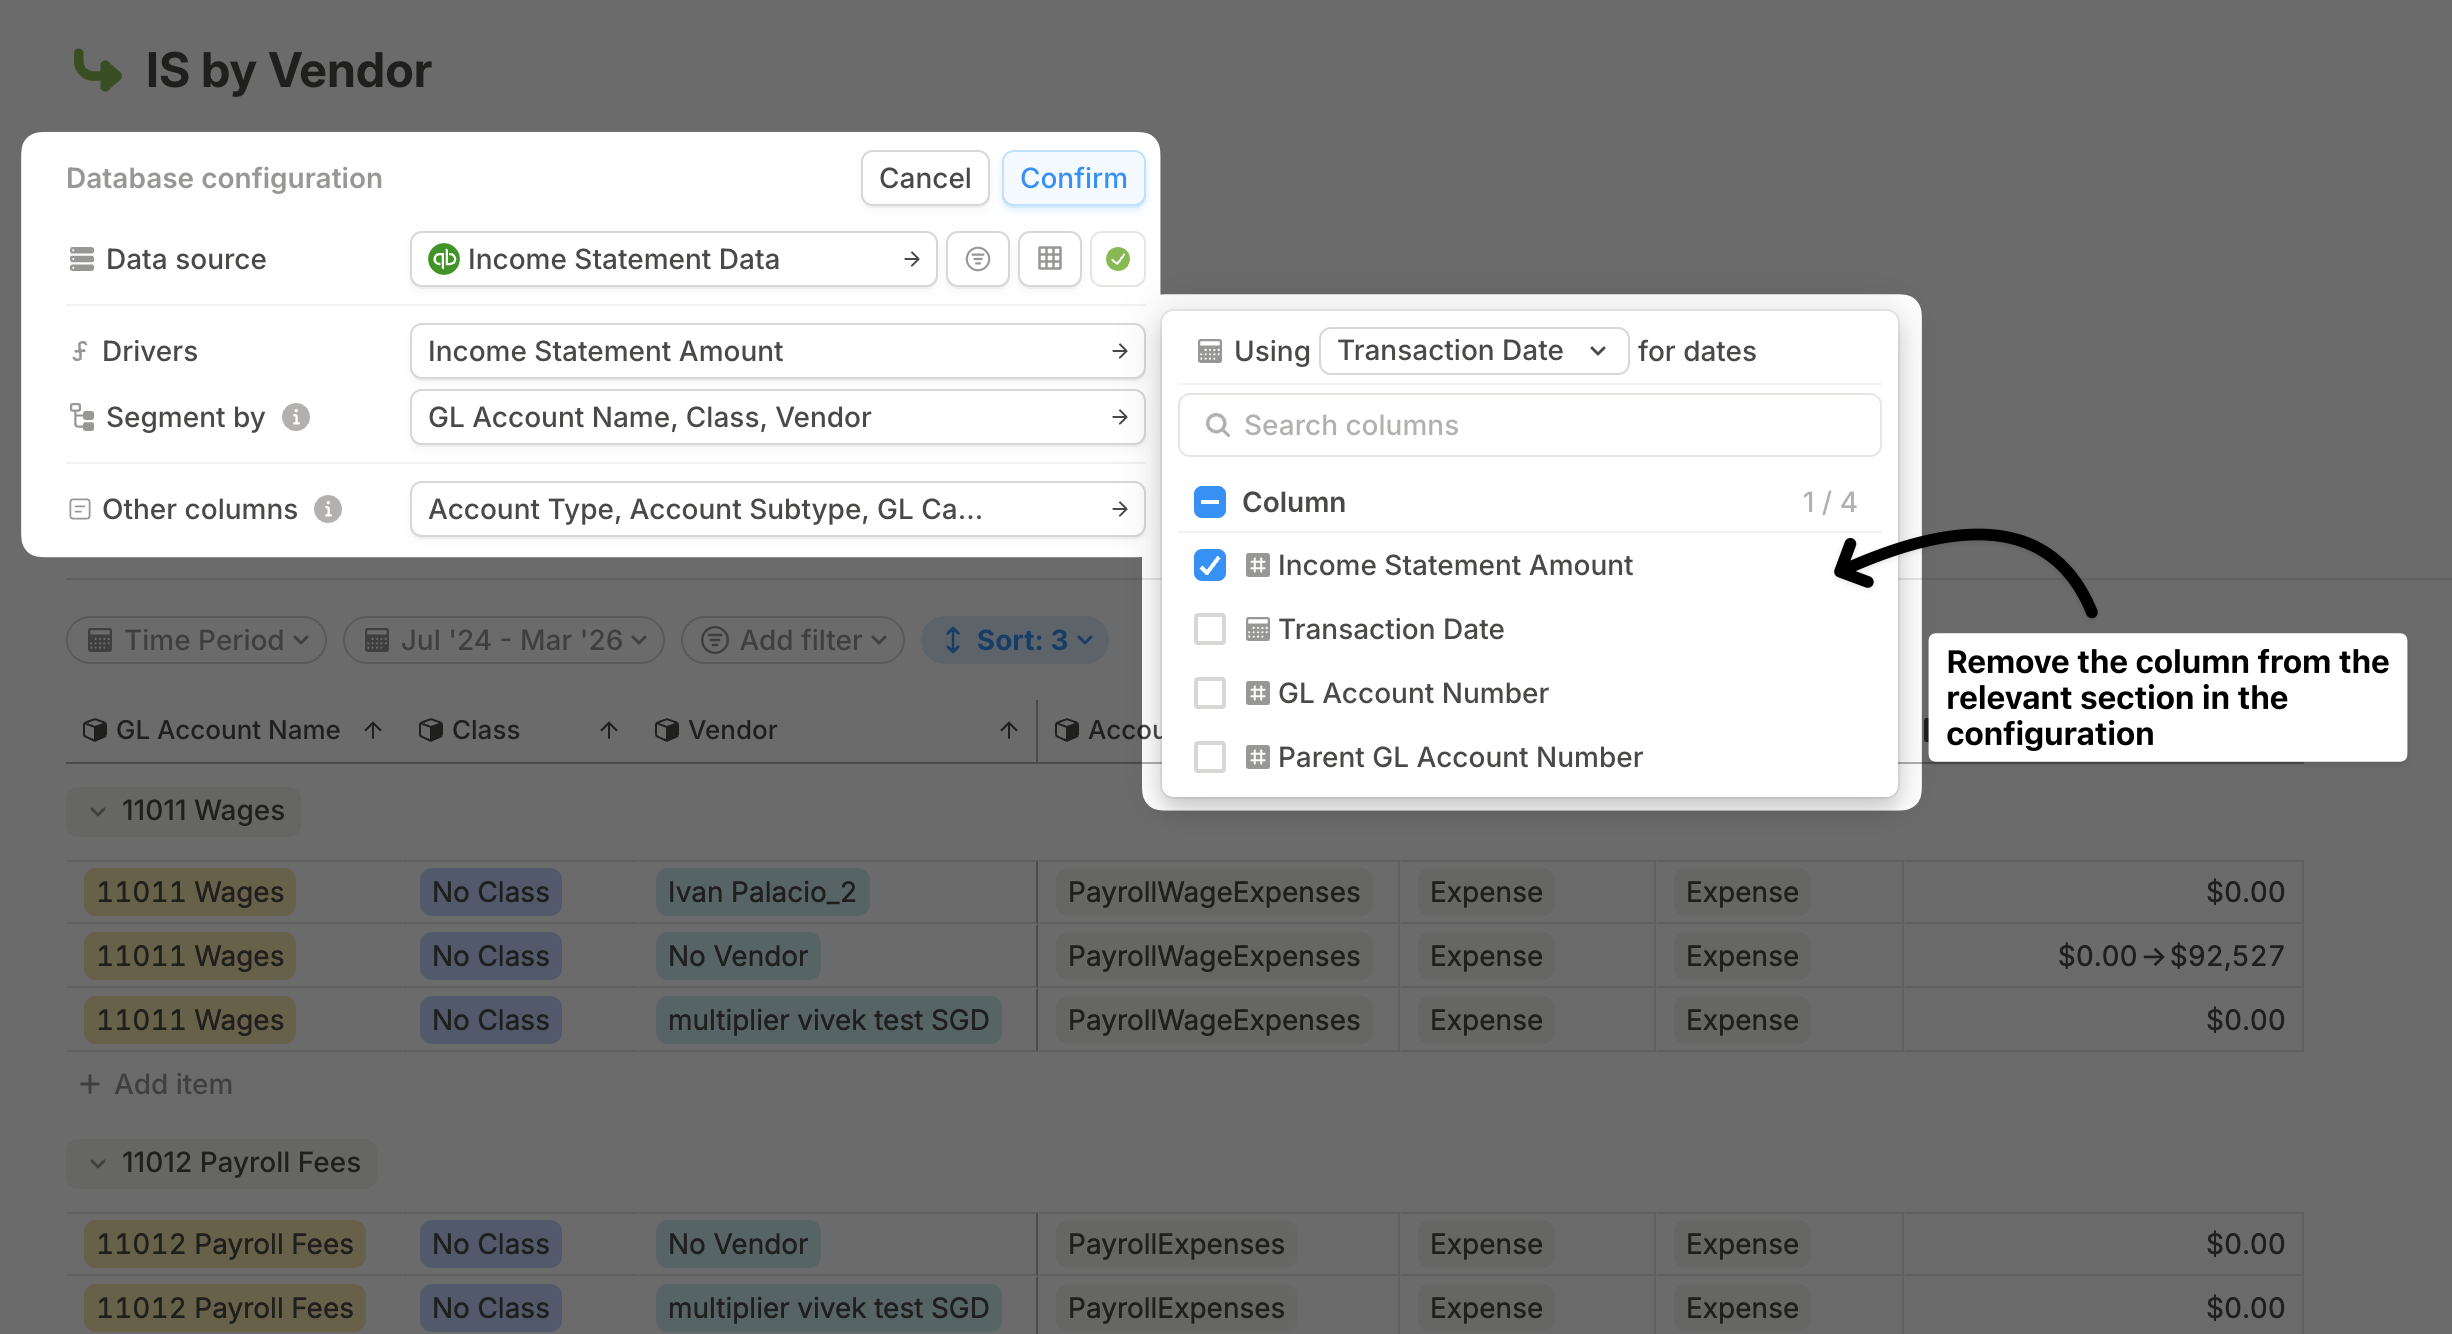
For columns coming from database configuration, remove the column from the relevant section in configuration: Driver, Segment by, or Other columns. This prevents it from reappearing after the next integration sync or configuration refresh.
Segmentation determines the granularity of your database. Each row should have a unique combination of dimension values. If a row does not have a unique combination, Runway shows a warning because that row is linked to other rows with the same segmentation.
For HRIS databases, follow the [HRIS database row flow](/concepts/databases/hris-databases).
## Deleting a column
The deletion flow depends on how the column was added.
For columns coming from database configuration, remove the column from the relevant section in configuration: Driver, Segment by, or Other columns. This prevents it from reappearing after the next integration sync or configuration refresh.
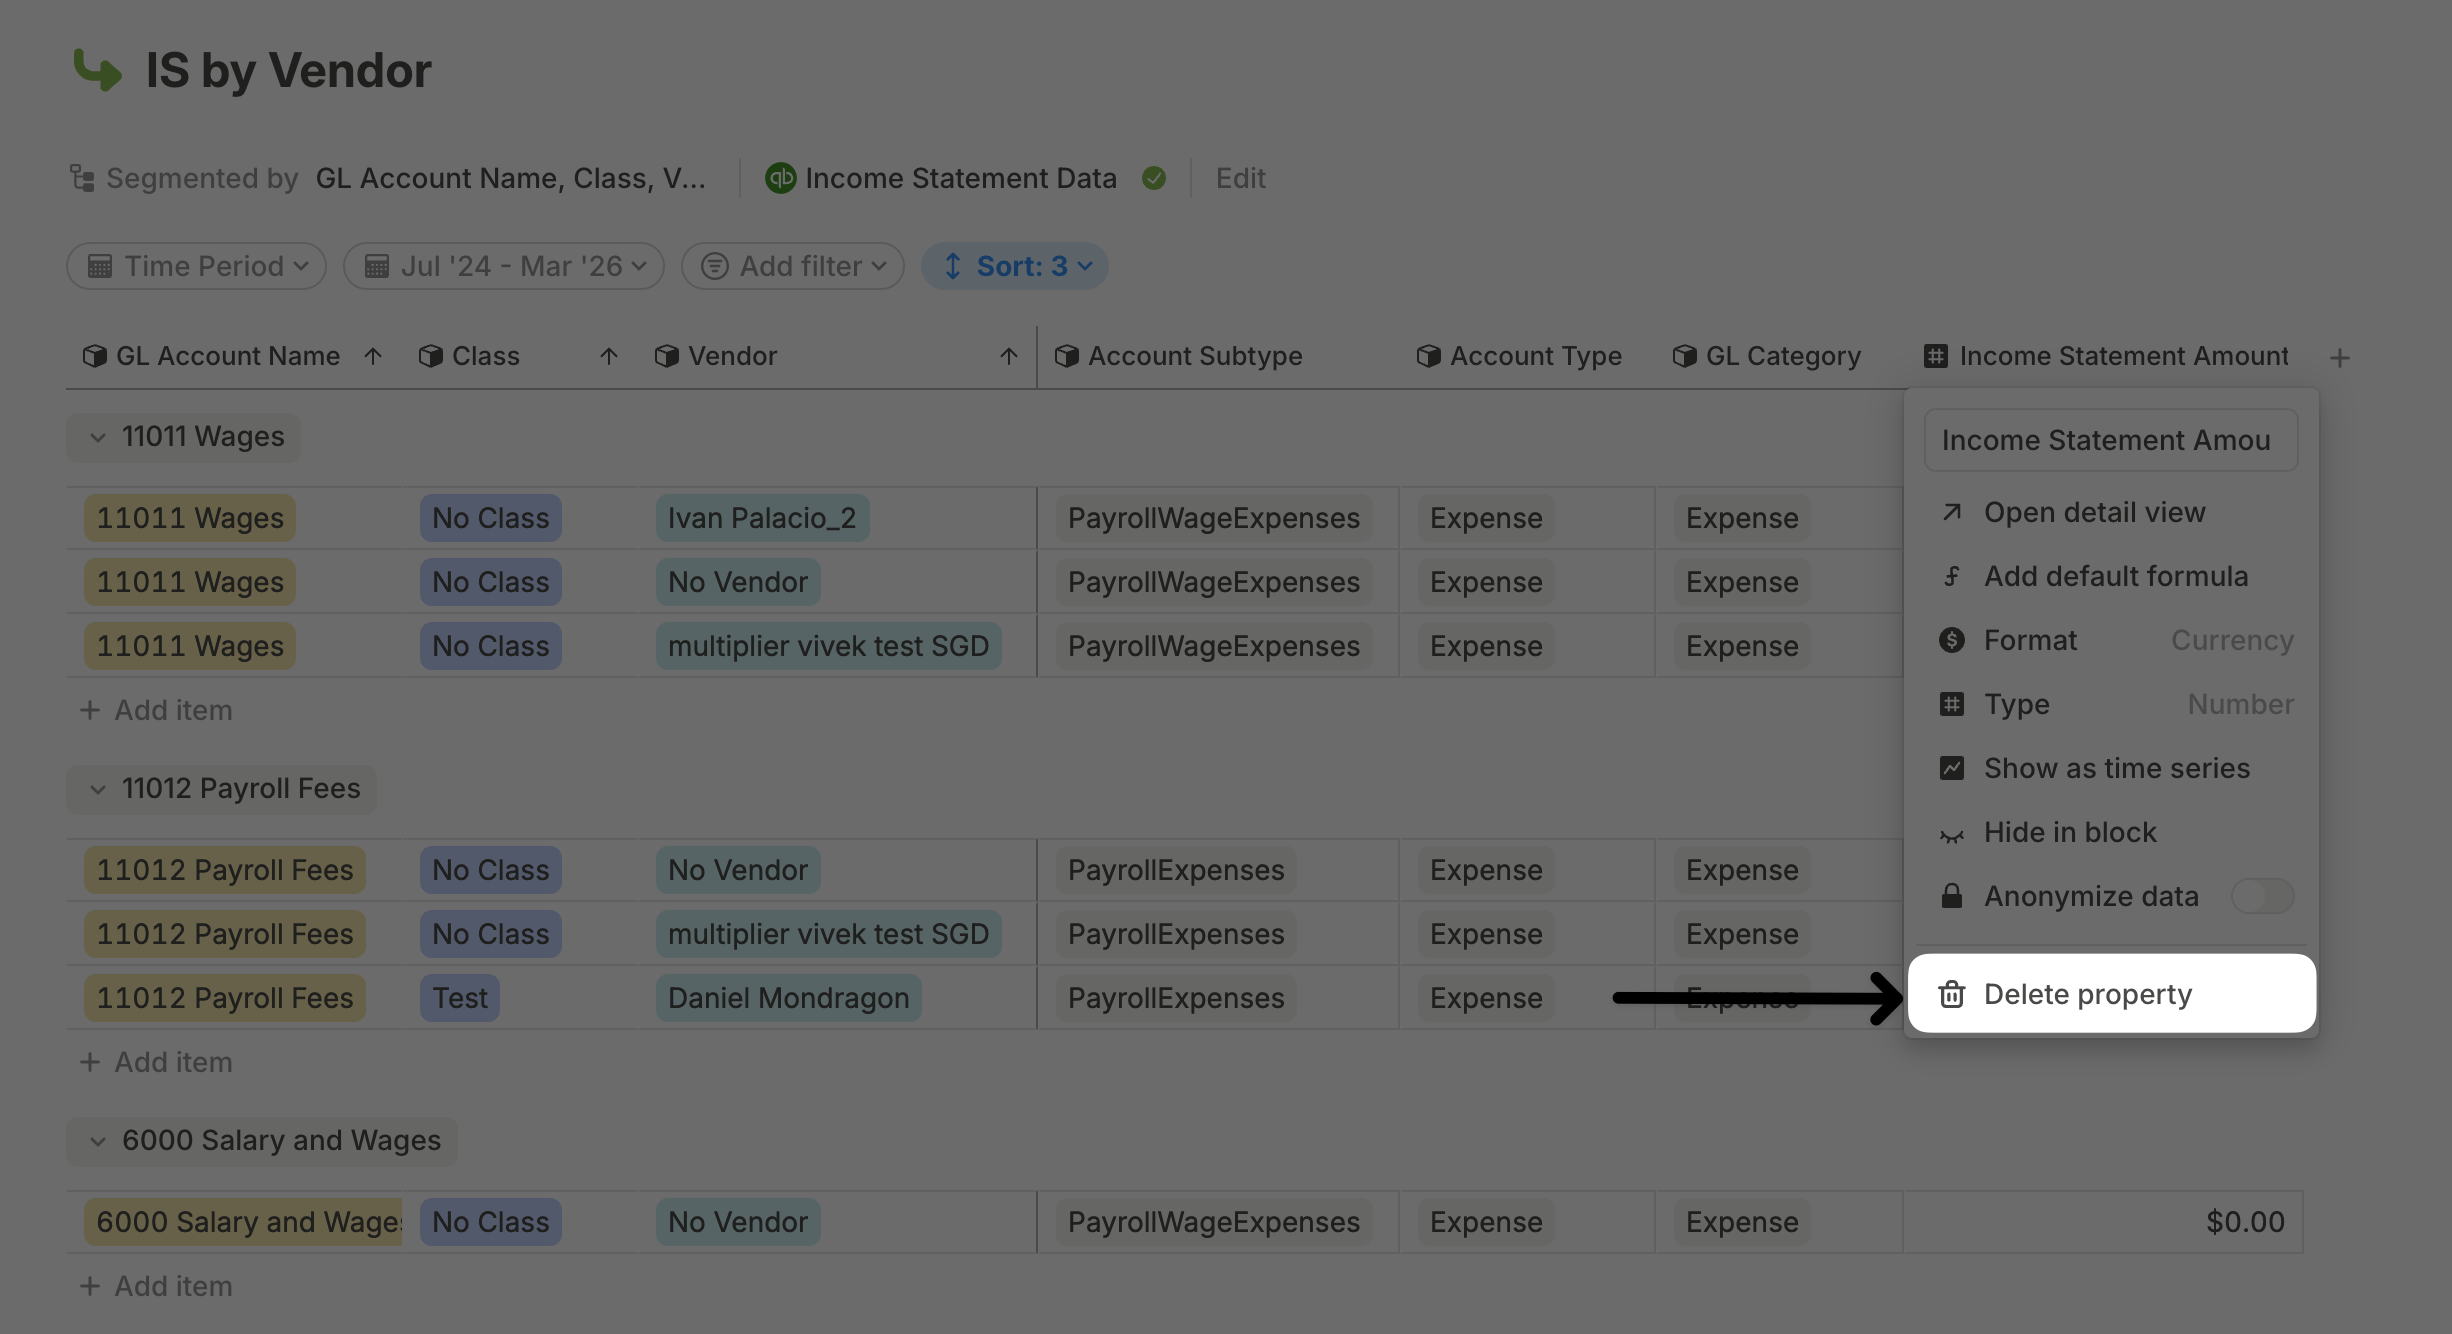
 For manually added columns, click the column header and select **Delete property**. If the column is used elsewhere in your model, Runway asks you to confirm because deleting it can cause reference errors.
 ## Deleting a row
To delete a row from a database, right-click the row and select **Delete row**.
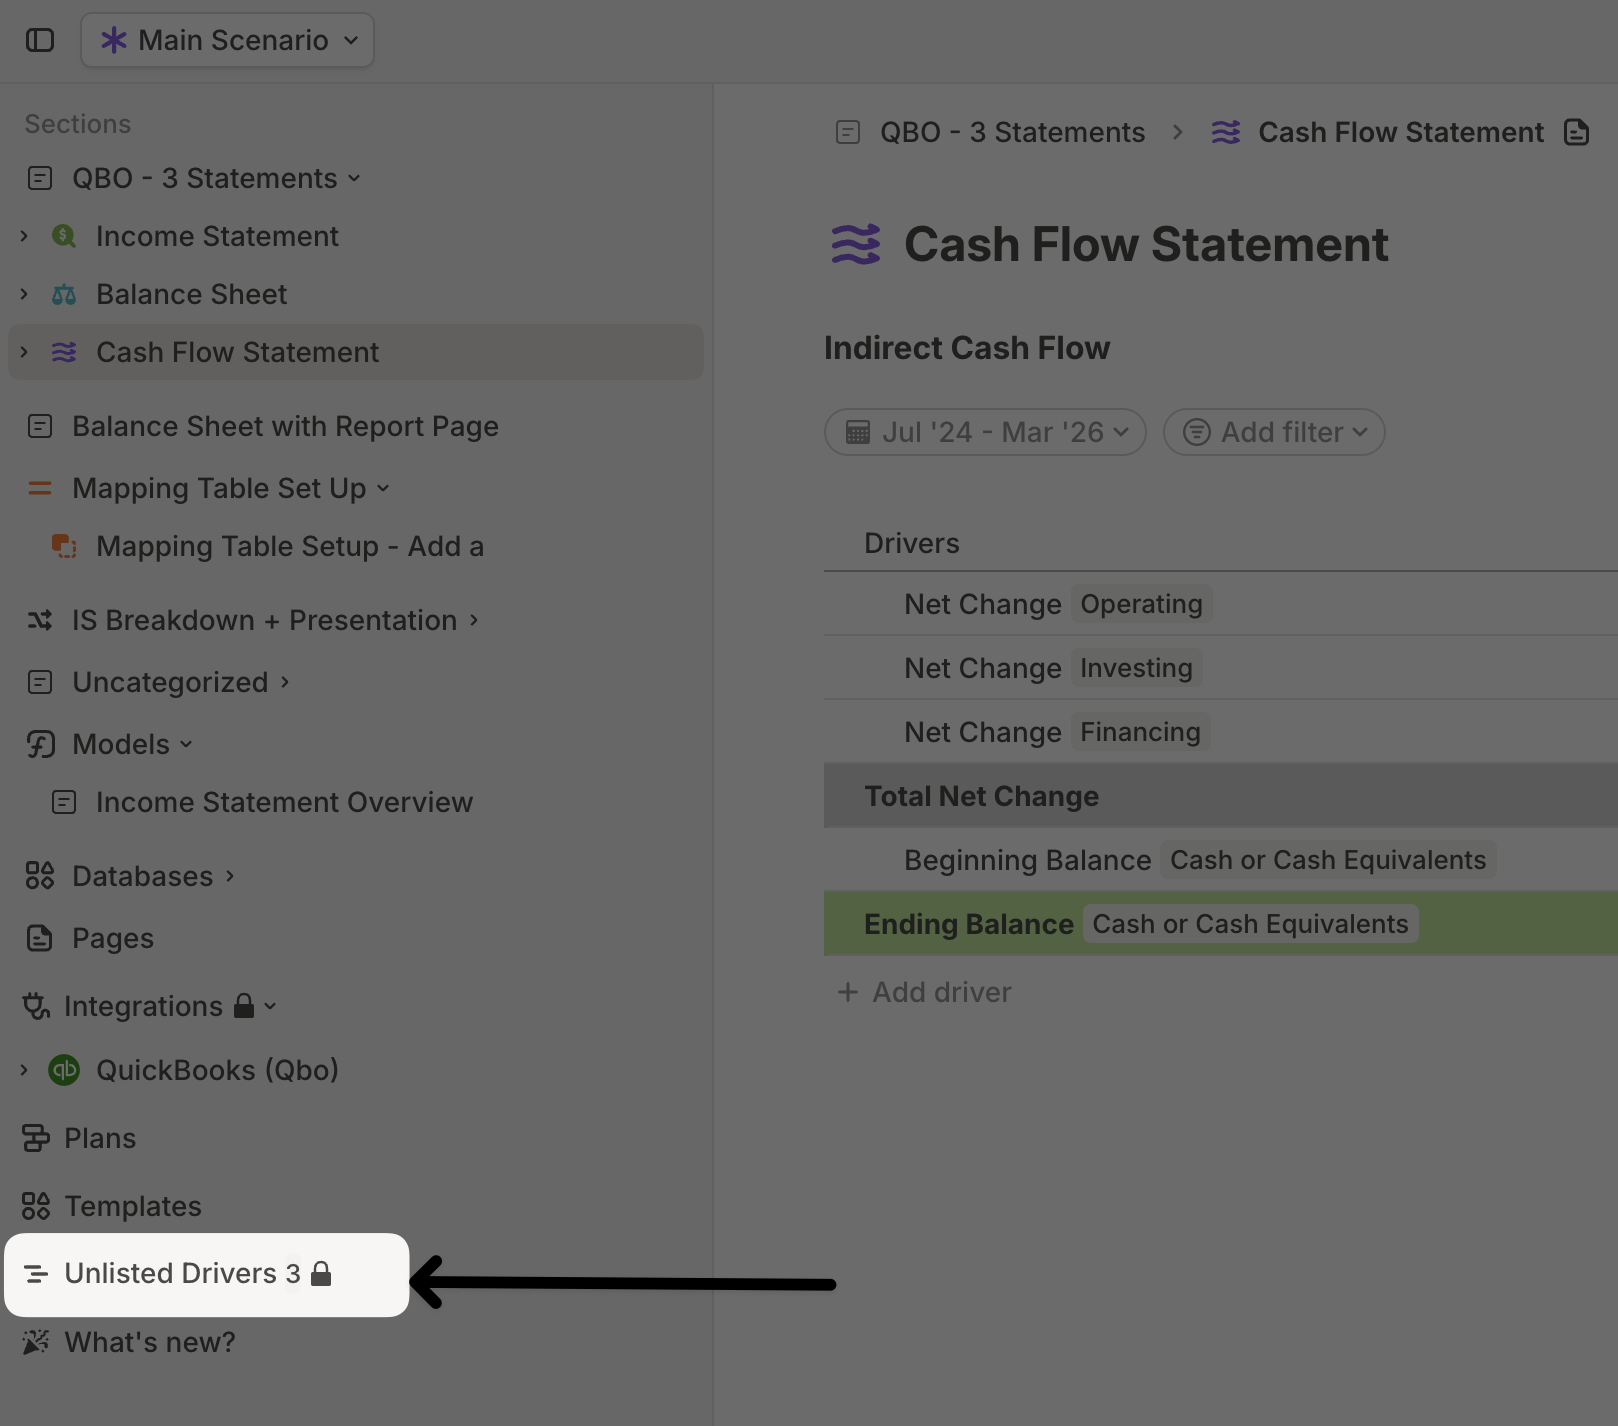
Deleting a row removes it from the database, but it does not delete the drivers connected to that row. Any formulas relying on those drivers remain unchanged, and the drivers still appear in your **Unlisted Drivers** page.
To fully delete a driver and eliminate its impact on formulas, delete it from **Unlisted Drivers**.
## Deleting a row
To delete a row from a database, right-click the row and select **Delete row**.
Deleting a row removes it from the database, but it does not delete the drivers connected to that row. Any formulas relying on those drivers remain unchanged, and the drivers still appear in your **Unlisted Drivers** page.
To fully delete a driver and eliminate its impact on formulas, delete it from **Unlisted Drivers**.
 ## What's next
* [Formulas in databases](/concepts/databases/formulas-in-databases)
* [Segmenting drivers](/concepts/dimensions/segmenting-drivers)
* [Database block](/concepts/pages/database-block)
## What's next
* [Formulas in databases](/concepts/databases/formulas-in-databases)
* [Segmenting drivers](/concepts/dimensions/segmenting-drivers)
* [Database block](/concepts/pages/database-block)